Answered step by step
Verified Expert Solution
Link Copied!

Question

1 Approved Answer

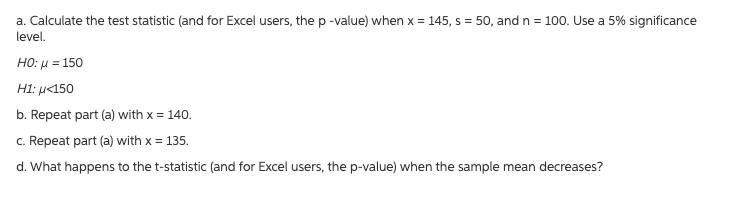
a) a. Calculate the test statistic {and for Excel users, the p value] when x = 145, s = 5G, and n = 1130. Use

a)

image text in transcribedimage text in transcribedimage text in transcribedimage text in transcribedimage text in transcribed
a. Calculate the test statistic {and for Excel users, the p value] when x = 145, s = 5G, and n = 1130. Use a 5% significance level. H0: ,u = 150 H1: pd b. Repeat part [a] wiw x = 140. c. Repeat part {a} with x = 135. d. 1ll'll'hat happens to the t-statisc [and for Excel users. the pvalue} when the sample mean decreases? a. A statistics practitioner calculated the mean and standard deviation from a sample of 51. They.r are I = 120 and 5 = 15. Estimate the population mean with 95% confidence. b. Repeat part [a] with a 95% confidence level. c. Repeat part {a} with an 50% condence level. d. What is the effect on the confidence interval estimate of decreasing the confidence level? a. The sample mean and standard deviation from a sample of 81 observations are x = 63 and s = 8. Estimate p with 95% confidence. b. Repeat part (a) with n = 64. c. Repeat part (a) with n = 36. d. Describe what happens to the confidence interval estimate when the sample size decreases.a. The sample mean and standard deviation from a random sample of 10 observations from a normal population were computed as x = 23 and s = 9. Calculate the value of the test statistic [and for Excel users, the pvalue} of the test required to determine whether there is enough evidence to infer at the 5% significance level that the population mean is greater than 20. b. Repeat part fa] with n = 3G. c. Repeat part {a} with n = 5D. d. Describe the effect on the t-statisijc Land for Excel users. the pvalue} of increasing the sample size. a. A statistics practitioner is in the process of testing to determine whether there is enough evidence to infer that the population mean is different from 180. She calculated the mean and standard deviation of a sample of 200 observations as x = 175 and s = 22. Calculate the value of the test statistic (and for Excel users, the p-value) of the test required to determine whether there is enough evidence at the 5% significance level. b. Repeat part (a) with s = 45. c. Repeat part (a) with s = 60. d. Discuss what happens to the t statistic (and for Excel users, the p-value) when the standard deviation increases

Step by Step Solution

There are 3 Steps involved in it

Step: 1

blur-text-image

Get Instant Access to Expert-Tailored Solutions

See step-by-step solutions with expert insights and AI powered tools for academic success

Step: 2

blur-text-image

Step: 3

blur-text-image

Ace Your Homework with AI

Get the answers you need in no time with our AI-driven, step-by-step assistance

Get Started

Recommended Textbook for

Holt Algebra 1 Ohio

Authors: Edward B. Burger, Holt, Rinehart And Winston

Student Edition

0030932947, 978-0030932946

More Books

Students also viewed these Mathematics questions