

Answered step by step
Verified Expert Solution
Question
1 Approved Answer
a . A sample of 1 0 0 arrivals of a customer at retail sales depot is according to the following distribution: table [
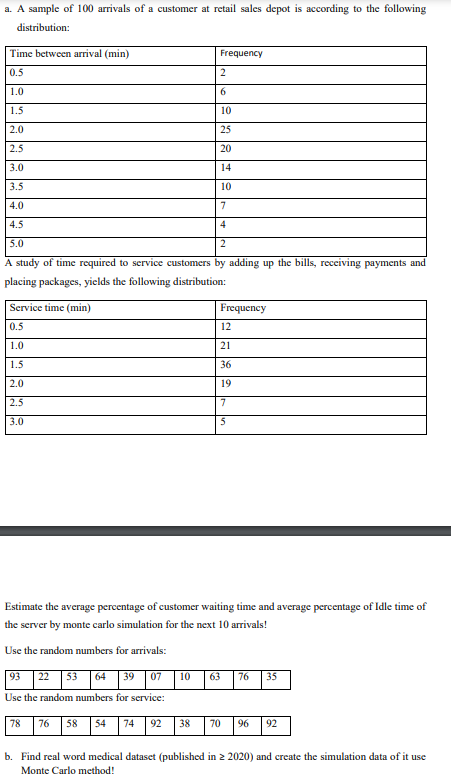
a A sample of arrivals of a customer at retail sales depot is according to the following distribution:
tableTime between arrival minFrequency
A study of time required to service customers by adding up the bills, receiving payments and placing packages, yields the following distribution:
tableService time minFrequency
Estimate the average percentage of customer waiting time and average percentage of Idle time of the server by monte carlo simulation for the next arrivals!
Use the random numbers for arrivals:
table
Use the random numbers for service:
table
b Find real word medical dataset published in and create the simulation data of it use Monte Carlo method!
Step by Step Solution
There are 3 Steps involved in it
Step: 1

Get Instant Access to Expert-Tailored Solutions
See step-by-step solutions with expert insights and AI powered tools for academic success
Step: 2

Step: 3
Ace Your Homework with AI
Get the answers you need in no time with our AI-driven, step-by-step assistance
Get Started
Project Management A Systems Approach to Planning Scheduling and Controlling
Authors: Harold Kerzner
10th Edition
978-047027870, 978-0-470-5038, 470278706, 978-0470278703