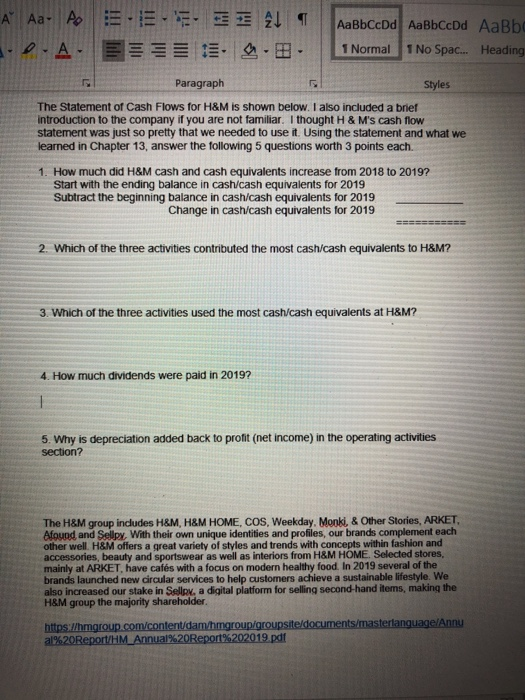
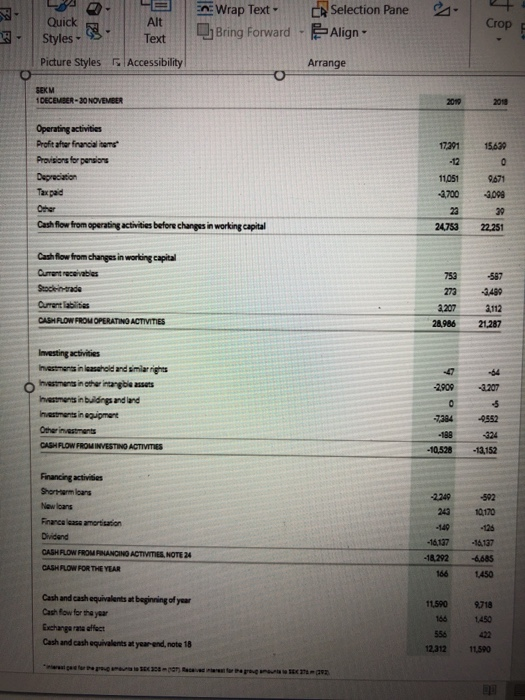
A Aa A E... 3 21 D.A ... AaBbCcDd AaBbCcDd AaBb 1 Normal 1 No Spac... Heading Paragraph Styles The Statement of Cash Flows for H&M is shown below. I also included a brief introduction to the company if you are not familiar. I thought H & M's cash flow statement was just so pretty that we needed to use it. Using the statement and what we learned in Chapter 13, answer the following 5 questions worth 3 points each. 1. How much did H&M cash and cash equivalents increase from 2018 to 2019? Start with the ending balance in cash/cash equivalents for 2019 Subtract the beginning balance in cash/cash equivalents for 2019 Change in cash/cash equivalents for 2019 2. Which of the three activities contributed the most cash cash equivalents to H&M? 3. Which of the three activities used the most cash cash equivalents at H&M? 4. How much dividends were paid in 2019? 5. Why is depreciation added back to profit (net income) in the operating activities section? The H&M group includes H&M, H&M HOME, COS, Weekday. Monki, & Other Stories, ARKET, Afound and Sellpy. With their own unique identities and profiles, our brands complement each other well. H&M offers a great variety of styles and trends with concepts within fashion and accessories, beauty and sportswear as well as interiors from H&M HOME. Selected stores, mainly at ARKET, have cafs with a focus on modern healthy food. In 2019 several of the brands launched new circular services to help customers achieve a sustainable lifestyle. We also increased our stake in Sellpy, a digital platform for selling second-hand items, making the H&M group the majority shareholder https://hmgroup.com/content/dam/hmgroup/groupsite/documents/masterlanguage/Annu al%20Report/HM Annual%20Report%202019.pdf Wrap Text CA Selection Pane Bring Forward -Align Crop Quick Alt Styles Text Picture Styles Accessibility Arrange SEKM 1 DECEMBER - 30 NOVEMBER 2010 17201 15,699 Operating activities Profit after financial terms Provision for persions Depreciation Tax paid -12 O 11051 2,700 28 9.671 -3.099 39 22.251 Cash flow from operating activities before changes in working capital 24.753 Cash flow from changes in working capital Current receivables Stocerade Current abilities CASH ROW FROM OPERATINO ACTIVITIES 753 273 2207 28,986 587 -3,499 2,112 21.287 -47 -54 -3.207 O -2909 Investing activities Investments in leasehold and similar rights hestments in other intangible assets Investments in buildings and land Investments in equipment Other investments CASH FLOW FROM INVESTINO ACTIVITIES o -7384 -138 -10.528 -2552 -324 -13,152 Financing activities Shortermans Newloans Finance lease amortisation Dividend CASHFLOW FROM PLANGING ACTIVITIES, NOTE 24 CASH FLOW FOR THE YEAR -2240 249 -140 -592 10,170 -16,137 -18,292 166 -16,137 -6,685 1.450 Cash and cash equivalents at beginning of year Cash fow for the year Exchange rare efect Cash and cash equivalents at year-end, note 18 11.590 166 9,718 1.450 556 12,312 11.590 BH


