Question
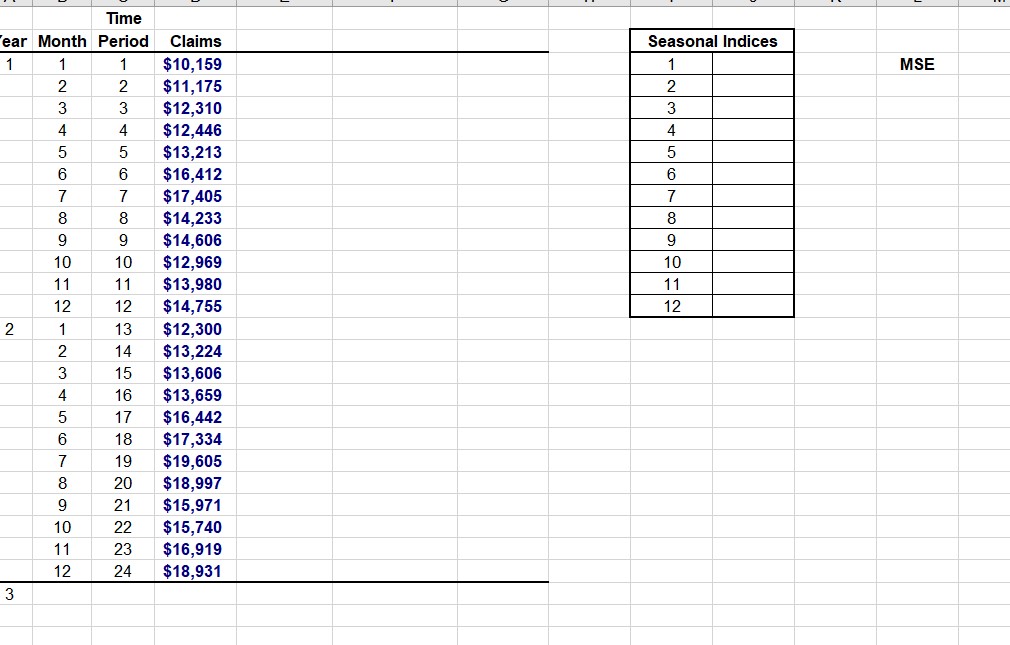
a. Add the appropriate column(s) to fit a quadratic trend model to the data. Use the TREND function and call this column Quadratic Trend). Forecast

a. Add the appropriate column(s) to fit a quadratic trend model to the data. Use the TREND function and call this column Quadratic Trend). Forecast for the first six months in Year 3.
b. Add a column and compute Actual as a % of Predicted (column name).
c. Calculate multiplicative seasonal indices for each month in the space provided.
d. Calculate Seasonal Prediction and forecast for the first six months into Year 3.
e. Prepare a line graph comparing the quadratic trend and seasonal predictions against the original data.
f. In the space provided, compute the MSE to see how well the seasonal prediction fits the actual claims data.
g. Based on the MSE, which seasonal prediction model is a better fit to the claims data, the linear or quadratic model?
\begin{tabular}{|c|l|} \hline \multicolumn{2}{|c|}{ Seasonal Indices } \\ \hline 1 & \\ \hline 2 & \\ \hline 3 & \\ \hline 4 & \\ \hline 5 & \\ \hline 6 & \\ \hline 7 & \\ \hline 8 & \\ \hline 9 & \\ \hline 10 & \\ \hline 11 & \\ \hline 12 & \\ \hline \end{tabular} 3Step by Step Solution
There are 3 Steps involved in it
Step: 1

Get Instant Access to Expert-Tailored Solutions
See step-by-step solutions with expert insights and AI powered tools for academic success
Step: 2

Step: 3

Ace Your Homework with AI
Get the answers you need in no time with our AI-driven, step-by-step assistance
Get Started


