Answered step by step
Verified Expert Solution
Question
1 Approved Answer
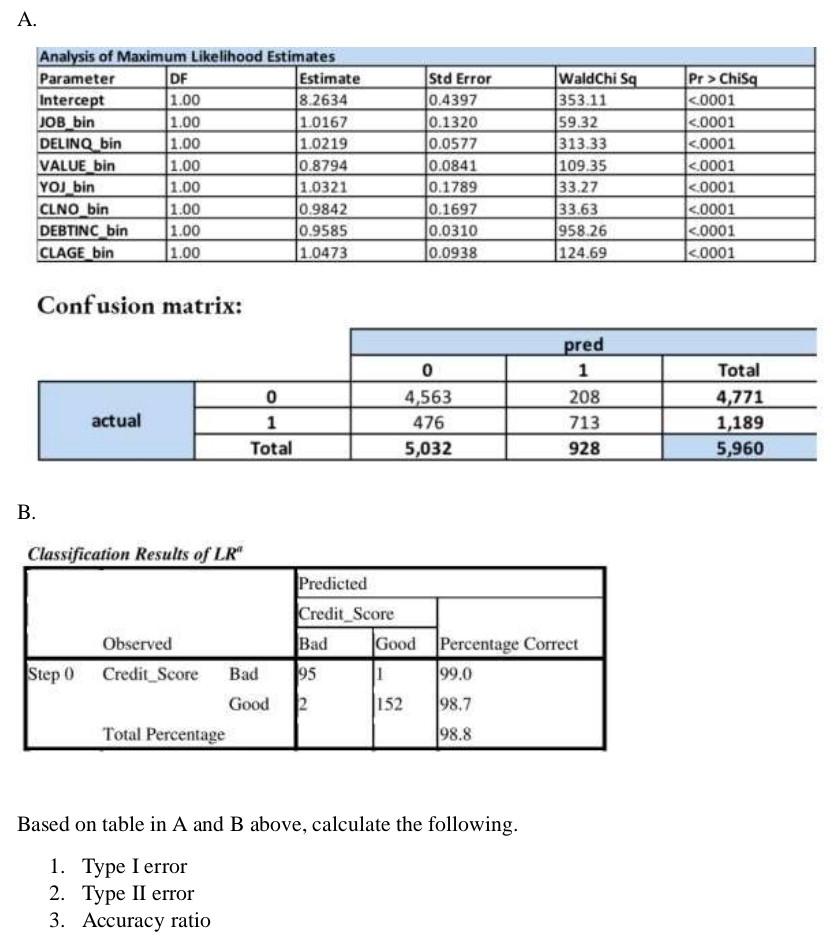
A. Analysis of Maximum Likelihood Estimates Parameter DF Estimate Intercept 1.00 8.2634 JOB_bin 1.00 1.0167 DELINQ bin 1.00 1.0219 VALUE_bin 1.00 0.8794 YOJ_bin 1.00 1.0321

A. Analysis of Maximum Likelihood Estimates Parameter DF Estimate Intercept 1.00 8.2634 JOB_bin 1.00 1.0167 DELINQ bin 1.00 1.0219 VALUE_bin 1.00 0.8794 YOJ_bin 1.00 1.0321 CLNO bin 1.00 0.9842 DEBTINC bin 1.00 0.9585 CLAGE bin 1.00 1.0473 Confusion matrix: actual B. Classification Results of LR Observed Good Percentage Correct Step 0 Credit Score Bad 1 99.0 H Good 152 98.7 98.8 Total Percentage Based on table in A and B above, calculate the following. 1. Type I error 2. Type II error 3. Accuracy ratio 0 1 Total Predicted Credit Score Bad 95 2 Std Error 0.4397 0.1320 0.0577 0.0841 0.1789 0.1697 0.0310 0.0938 0 4,563 476 5,032 WaldChi Sq 353.11 59.32 313.33 109.35 33.27 33.63 958.26 124.69 pred 1 208 713 928 Pr>ChiSq <.0001 total a. analysis of maximum likelihood estimates parameter df estimate intercept job_bin delinq bin value_bin yoj_bin clno debtinc clage confusion matrix: actual b. classification results lr observed good percentage correct step credit score bad h based on table in a and b above calculate the following. type i error ii accuracy ratio predicted std waldchi sq pred pr>ChiSq <.0001 total>
Step by Step Solution
There are 3 Steps involved in it
Step: 1

Get Instant Access to Expert-Tailored Solutions
See step-by-step solutions with expert insights and AI powered tools for academic success
Step: 2

Step: 3

Ace Your Homework with AI
Get the answers you need in no time with our AI-driven, step-by-step assistance
Get Started


