Answered step by step
Verified Expert Solution
Question
1 Approved Answer
A) Assume that the graph below is the loanable funds market. Identify curves 1 and 2 and each axis. (5pts) X 1 B) Referencing the
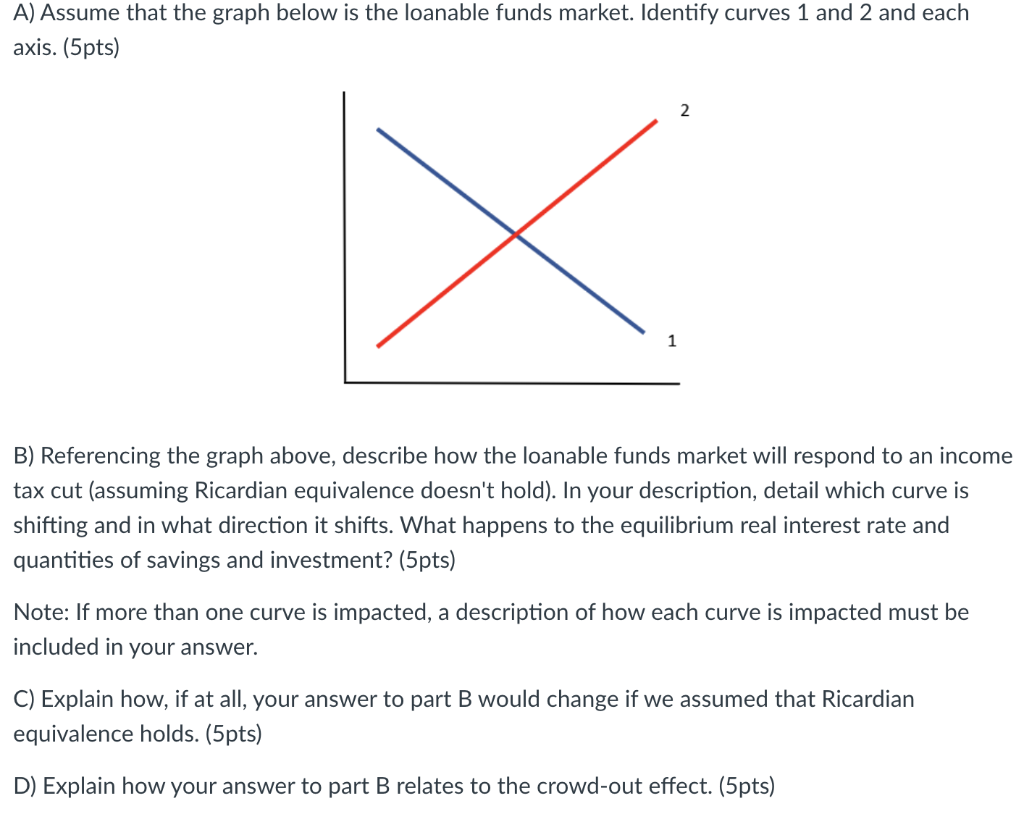
A) Assume that the graph below is the loanable funds market. Identify curves 1 and 2 and each axis. (5pts) X 1 B) Referencing the graph above, describe how the loanable funds market will respond to an income tax cut (assuming Ricardian equivalence doesn't hold). In your description, detail which curve is shifting and in what direction it shifts. What happens to the equilibrium real interest rate and quantities of savings and investment? (5pts) Note: If more than one curve is impacted, a description of how each curve is impacted must be included in your answer. C) Explain how, if at all, your answer to part B would change if we assumed that Ricardian equivalence holds. (5pts) D) Explain how your answer to part B relates to the crowd-out effect. (5pts)
Step by Step Solution
There are 3 Steps involved in it
Step: 1
Get Instant Access to Expert-Tailored Solutions
See step-by-step solutions with expert insights and AI powered tools for academic success
Step: 2
Step: 3
Ace Your Homework with AI
Get the answers you need in no time with our AI-driven, step-by-step assistance
Get Started