

Question
(a) Aviation is among the industries that were adversely impacted by Covid. Below table shows selective financial ratios of Singapore Airlines (SIA), for five semi-annual
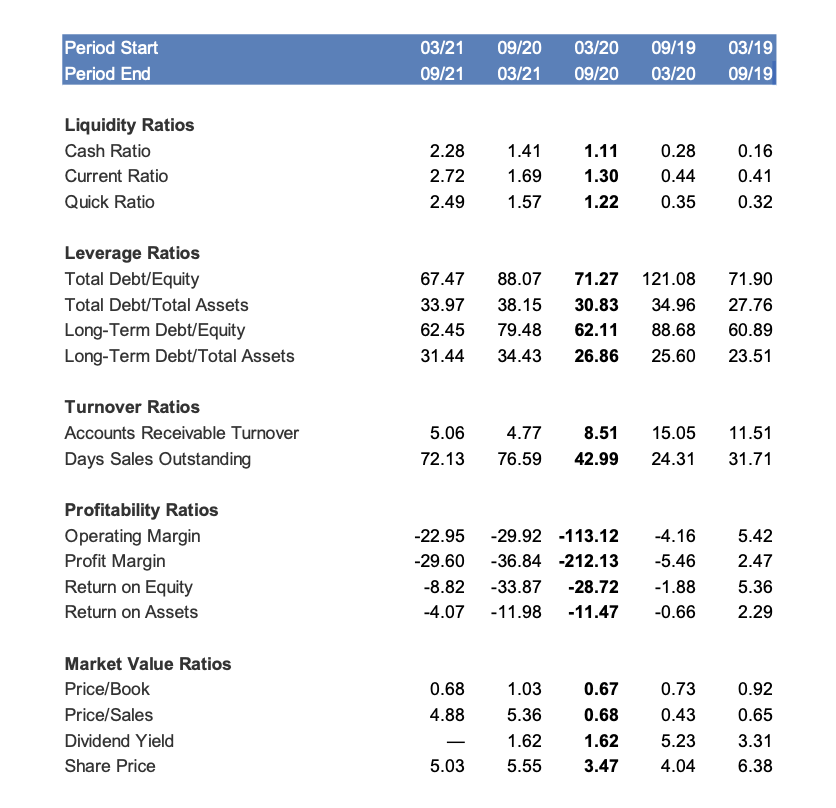
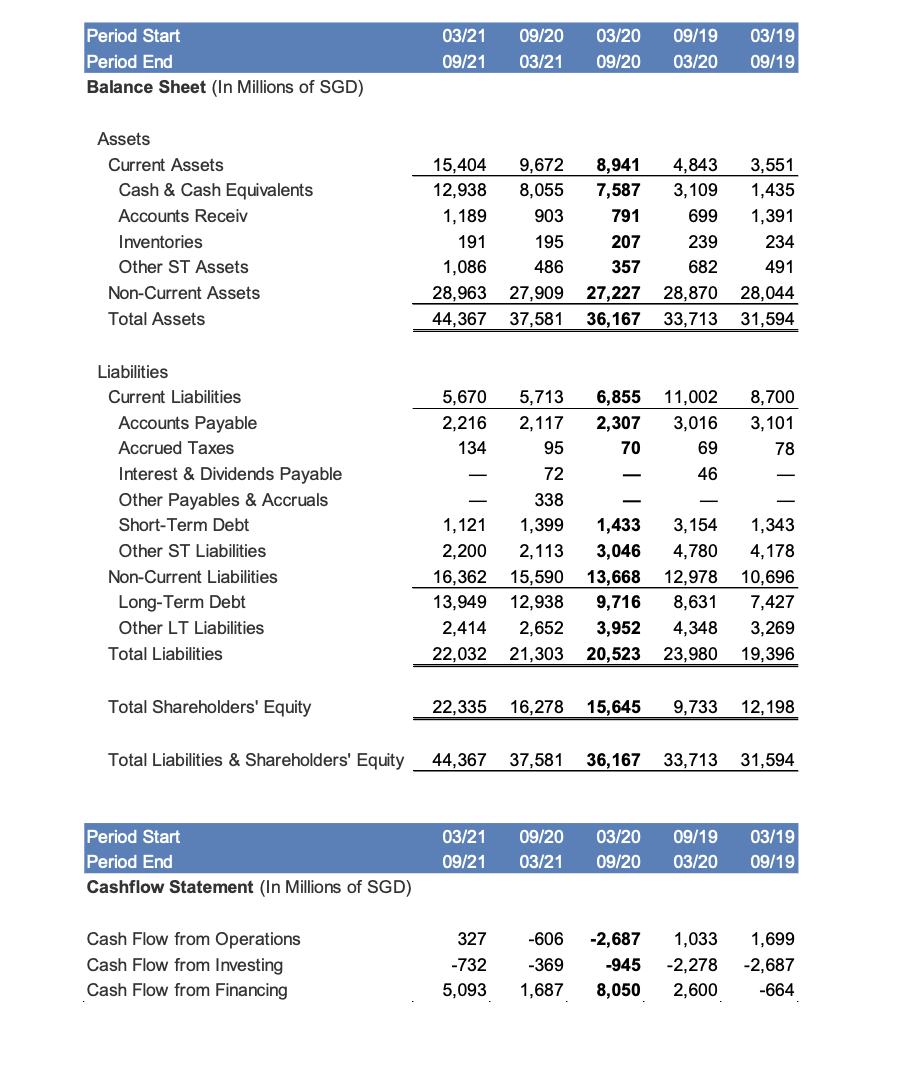
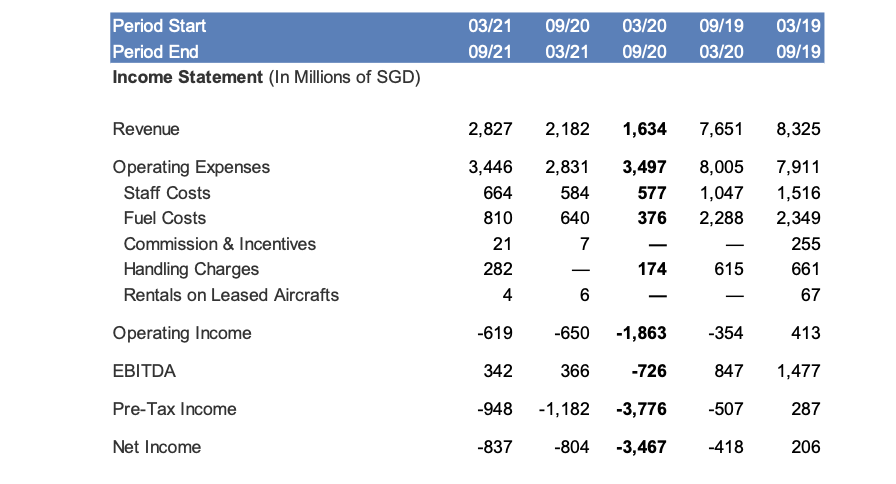
(a) Aviation is among the industries that were adversely impacted by Covid. Below table shows selective financial ratios of Singapore Airlines (SIA), for five semi-annual fiscal periods, including both before and after Covid outbreak (period of March 2020 September 2020, highlighted with bond font). Financial Statements are also provided.
Analyse the impact of Covid outbreak on SIAs FIVE categories of financial ratios (i.e. Liquidity, leverage, turnover, profitability and market value). [Hint: Elaborate your finding with information from financial statements and attempt to connect the numbers with business activities.]
The presentation of the answer should be well-organized.
(Word limit of answer less than 700 words)
(b)
Examine the effect of the actions below on the current ratio. Assume that the prevailing current ratio is higher than 1.0.
(i) Use cash to pay off current liability of $10,000
(ii) Purchase raw materials amounting to $10,000 on credit
(iii) Sale of inventory
(iv) Paying a dividend
Analyse the effect of the actions below on the debt/equity ratio. Assume current debt/equity ratio is 0.5.
(v) Issuing new equity
(vi) Account receivable collected
(vii) Sell goods on book value, on cash basis
(viii) Pay off the companys long term bank loan
PeriodStartPeriodEnd03/2109/2109/2003/2103/2009/2009/1903/2003/1909/19 Liquidity Ratios Cash Ratio Current Ratio Quick Ratio Leverage Ratios Total Debt/Equity Total Debt/Total Assets Turnover Ratios AccountsReceivableTurnoverDaysSalesOutstanding5.0672.134.7776.598.5142.9915.0524.3111.5131.71 Profitability Ratios OperatingMarginProfitMarginReturnonEquityReturnonAssetsMarketValueRatiosPrice/BookPrice/SalesDividendYieldSharePrice22.9529.608.824.070.684.885.0329.9236.8433.8711.981.035.361.625.55113.12212.1328.7211.470.670.681.623.474.165.461.880.660.730.435.234.045.422.475.362.290.920.653.316.38 \begin{tabular}{llllll} Period Start & 03/21 & 09/20 & 03/20 & 09/19 & 03/19 \\ Period End & 09/21 & 03/21 & 09/20 & 03/20 & 09/19 \\ \hline Balance Sheet (In Millions of SGD) & & & & & \end{tabular} Assets \begin{tabular}{llllll} \hline Period Start & 03/21 & 09/20 & 03/20 & 09/19 & 03/19 \\ Period End & 09/21 & 03/21 & 09/20 & 03/20 & 09/19 \end{tabular} CashFlowfromOperationsCashFlowfromInvestingCashFlowfromFinancing3277325,0936063691,6872,6879458,0501,0332,2782,6001,6992,687664 PeriodStartPeriodEnd03/2109/2109/2003/2103/2009/2009/1903/2003/1909/19 RevenueOperatingExpensesStaffCostsFuelCostsCommission&IncentivesHandlingChargesRentalsonLeasedAircraftsOperatingIncomeEBITDAPre-TaxIncomeNetIncome2,8273,4466648102128246193429488372,1822,831584640766503661,1828041,6343,4975773761741,8637263,7763,4677,6518,0051,0472,2886153548475074188,3257,9111,5162,349255661674131,477287206 PeriodStartPeriodEnd03/2109/2109/2003/2103/2009/2009/1903/2003/1909/19 Liquidity Ratios Cash Ratio Current Ratio Quick Ratio Leverage Ratios Total Debt/Equity Total Debt/Total Assets Turnover Ratios AccountsReceivableTurnoverDaysSalesOutstanding5.0672.134.7776.598.5142.9915.0524.3111.5131.71 Profitability Ratios OperatingMarginProfitMarginReturnonEquityReturnonAssetsMarketValueRatiosPrice/BookPrice/SalesDividendYieldSharePrice22.9529.608.824.070.684.885.0329.9236.8433.8711.981.035.361.625.55113.12212.1328.7211.470.670.681.623.474.165.461.880.660.730.435.234.045.422.475.362.290.920.653.316.38 \begin{tabular}{llllll} Period Start & 03/21 & 09/20 & 03/20 & 09/19 & 03/19 \\ Period End & 09/21 & 03/21 & 09/20 & 03/20 & 09/19 \\ \hline Balance Sheet (In Millions of SGD) & & & & & \end{tabular} Assets \begin{tabular}{llllll} \hline Period Start & 03/21 & 09/20 & 03/20 & 09/19 & 03/19 \\ Period End & 09/21 & 03/21 & 09/20 & 03/20 & 09/19 \end{tabular} CashFlowfromOperationsCashFlowfromInvestingCashFlowfromFinancing3277325,0936063691,6872,6879458,0501,0332,2782,6001,6992,687664 PeriodStartPeriodEnd03/2109/2109/2003/2103/2009/2009/1903/2003/1909/19 RevenueOperatingExpensesStaffCostsFuelCostsCommission&IncentivesHandlingChargesRentalsonLeasedAircraftsOperatingIncomeEBITDAPre-TaxIncomeNetIncome2,8273,4466648102128246193429488372,1822,831584640766503661,1828041,6343,4975773761741,8637263,7763,4677,6518,0051,0472,2886153548475074188,3257,9111,5162,349255661674131,477287206Step by Step Solution
There are 3 Steps involved in it
Step: 1

Get Instant Access to Expert-Tailored Solutions
See step-by-step solutions with expert insights and AI powered tools for academic success
Step: 2

Step: 3
Ace Your Homework with AI
Get the answers you need in no time with our AI-driven, step-by-step assistance
Get Started
Fundamentals Of Health Care Financial Management
Authors: Steven Berger
4th Edition
1118801687, 978-1118801680