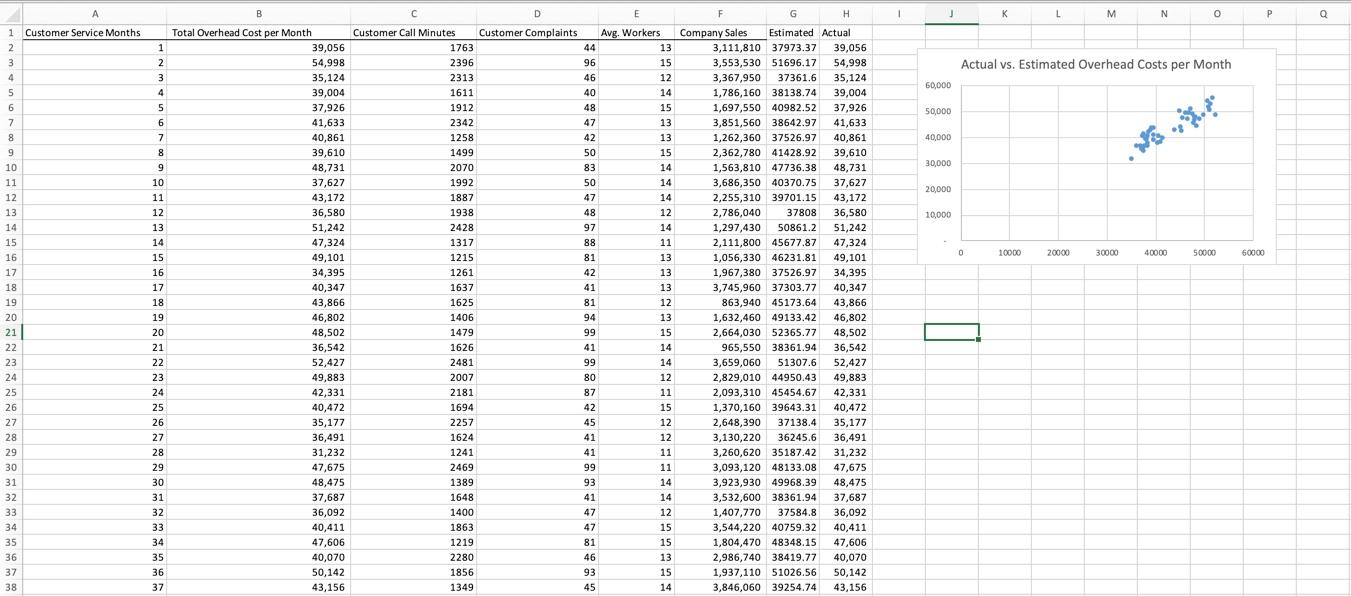
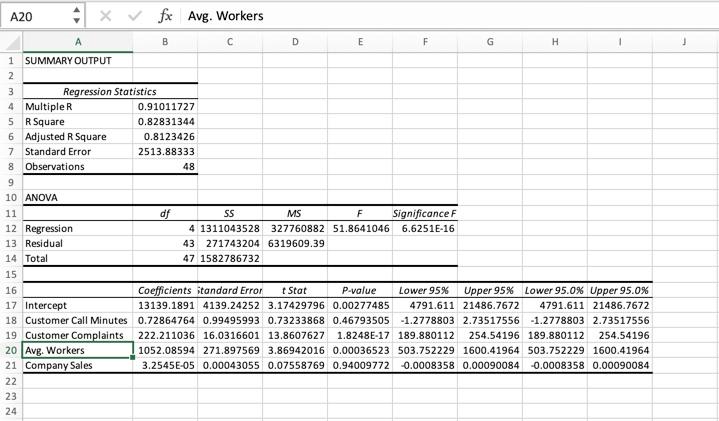
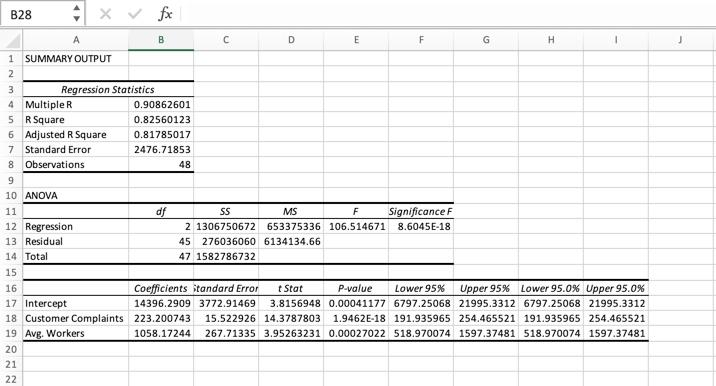
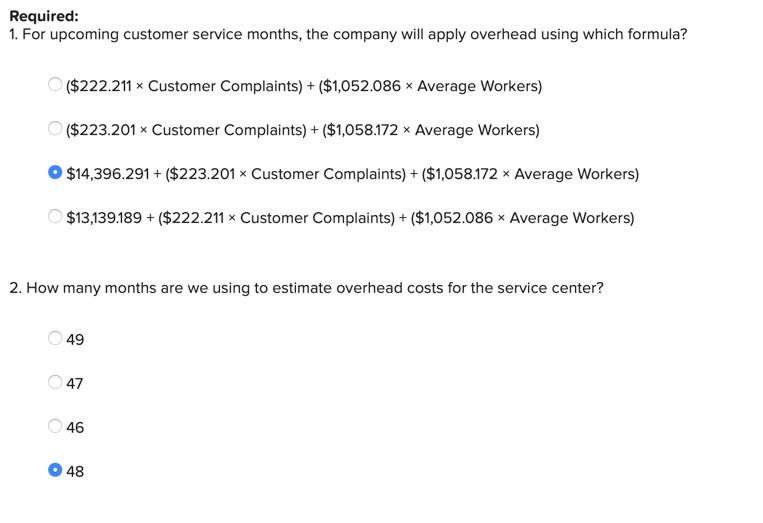
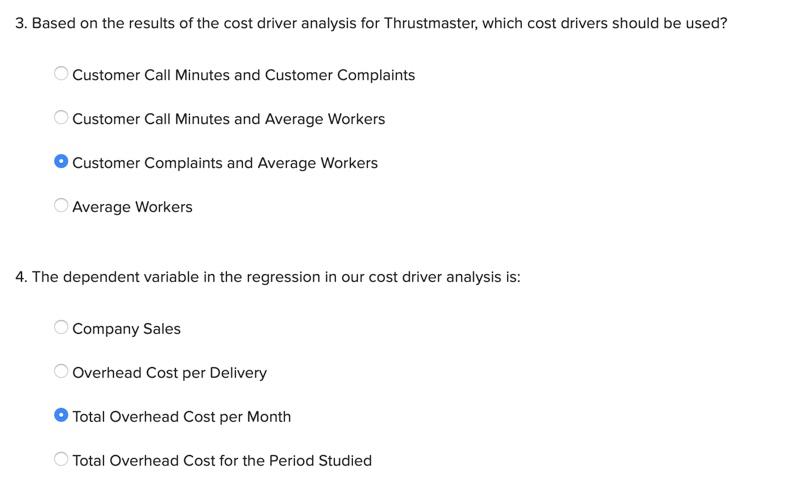
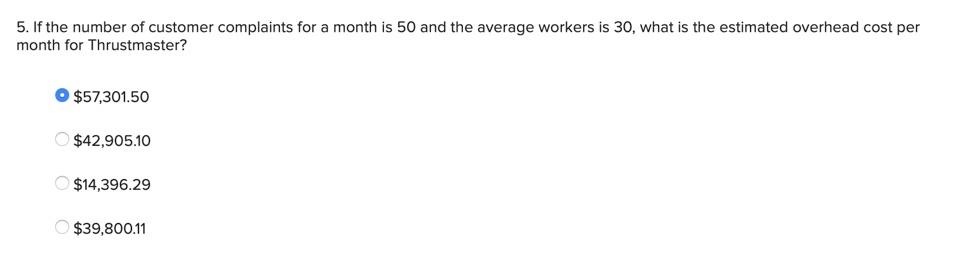
A B C D E 1 J K L M N o P Q 1 Customer Service Months 2 1 2 3 Actual vs. Estimated Overhead Costs per Month 60,000 4 50,000 3 4 5 6 7 8 9 10 11 12 13 40,000 5 6 7 8 8 9 9 10 30,000 20,000 10,000 0 10000 20000 30000 40000 50000 60000 14 15 16 17 18 19 20 21 22 23 24 25 26 27 28 29 30 31 11 12 13 14 15 16 17 18 19 20 21 22 23 24 25 26 27 28 29 30 Total Overhead Cost per Month 39,056 54,998 35,124 39,004 37,926 41,633 40,861 39,610 48,731 37,627 43,172 36,580 51,242 47,324 49,101 34,395 40,347 43,866 46,802 48,502 36,542 52.427 49,883 42,331 40,472 35,177 36,491 31,232 47,675 48,475 37,687 36,092 40,411 47,606 40,070 50,142 43,156 Customer Call Minutes Customer Complaints Avg. Workers 1763 44 13 2396 96 15 2313 46 12 1611 40 14 1912 48 15 2342 47 13 1258 42 13 1499 50 15 2070 83 14 1992 50 14 1887 47 14 1938 48 12 2428 97 14 1317 88 11 1215 81 13 1261 42 13 1637 41 13 1625 81 12 1406 94 13 1479 99 15 1626 41 14 2481 99 14 2007 80 12 2181 87 11 1694 42 15 2257 45 12 1624 41 12 1241 41 11 2469 99 11 1389 93 14 1648 41 14 1400 47 12 1863 47 15 1219 81 15 2280 46 13 1856 93 15 1349 45 14 F G . Company Sales Estimated Actual 3,111,810 37973.37 39,056 3,553,530 51696.17 54,998 3,367,950 37361.6 35.124 1,786,160 38138.74 39,004 1,697,550 40982.52 37,926 3,851,560 38642.97 41,633 1,262,360 37526.97 40,861 2,362,780 41428.92 39,610 1,563,810 47736.38 48,731 3,686,350 40370.75 37,627 2,255,310 39701.15 43,172 2,786,040 37808 36,580 1,297,430 50861.2 51,242 2,111,800 45677.87 47,324 1,056,330 46231.81 49,101 1,967,380 37526.97 34,395 3,745,960 37303.77 40,347 863,940 45173.64 43,866 1,632,460 49133.42 46,802 2,664,030 52365.77 48,502 965,550 38361.94 36,542 3,659,060 51307.6 52,427 2,829,010 44950.43 49.883 2,093,310 45454.67 42,331 1,370,160 39643.31 40,472 2,648,390 37138.4 35,177 3,130,220 36245.6 36,491 3,260,620 35187.42 31,232 3,093,120 48133.08 47,675 3,923,930 49968.39 48,475 3,532,600 38361.94 37,687 1,407,770 37584.8 36,092 3,544,220 40759.32 40,411 1,804,470 48348.15 47,606 2,986,740 38419.77 40,070 1,937,110 51026.56 50,142 3,846,060 39254.74 43,156 32 33 31 32 33 34 35 36 37 38 34 35 36 37 42,701 49,216 39 40 41 42 43 45,428 80 88 98 92 49 44 45 46 47 48 49 50 38 39 40 41 42 43 44 45 46 47 48 46,698 42,436 38,806 44,215 50,796 36,588 46,471 53,721 1205 1314 1969 1832 2439 2332 1711 1905 2222 2108 1922 11 12 11 11 13 14 14 11 12 14 14 2,696,670 43892.26 1,329,160 46736.04 2,712,170 47909.88 1,330,060 46570.67 3,641,900 39089.38 3,174,290 39701.15 3,551,590 48405.98 3,025,140 47240.28 2,936,070 36915.2 3,676,490 47959.58 2,601,950 50637.99 42,701 49,216 45,428 46,698 42,436 38,806 44,215 50,796 36,588 46,471 53,721 86 95 44 84 96 A20 2 x fx Avg. Workers B D E F G H 1 SUMMARY OUTPUT 2 3 Regression Statistics 4 Multiple R 0.91011727 5 R Square 0.82831344 6 Adjusted R Square 0.8123426 7 Standard Error 2513.88333 8 Observations 48 9 10 ANOVA 11 df SS MS F Significance F 12 Regression 4 1311043528 327760882 51.8641046 6.6251E-16 13 Residual 43 271743204 6319609.39 14 Total 47 1582786732 15 16 Coefficients tandard Error t Stat P-value Lower 95% Upper 95% Lower 95.0% Upper 95.0% 17 Intercept 13139.1891 4139.24252 3.17429796 0.00277485 4791.611 21486.7672 4791.611 21486.7672 18 Customer Call Minutes 0.72864764 0.99495993 0.73233868 0.46793505 -1.2778803 2.73517556 -1.2778803 2.73517556 19 Customer Complaints 222.211036 16.0316601 13.8607627 1.8248E-17 189.880112 254.54196 189.880112 254.54196 20 Avg. Workers 1052.08594 271.897569 3.86942016 0.00036523 503.752229 1600.41964 503.752229 1600.41964 21 Company Sales 3.2545E-05 0.00043055 0.07558769 0.94009772 -0.0008358 0.00090084 -0.0008358 0.00090084 22 23 24 B28 A B D E F G H 1 SUMMARY OUTPUT 2 3 Regression Statistics 4 Multiple R 0.90862601 5 R Square 0.82560123 6 Adjusted R Square 0.81785017 7 Standard Error 2476.71853 8 Observations 48 9 10 ANOVA 11 df SS MS F Significance F 12 Regression 2 1306750672 653375336 106.514671 8.6045E-18 13 Residual 45 276036060 6134134.66 14 Total 47 1582786732 15 16 Coefficients Standard Error t Stat P-value Lower 95% Upper 95% Lower 95.0% Upper 95.0% 17 Intercept 14396.2909 3772.91469 3.8156948 0.00041177 6797.25068 21995.3312 6797.25068 21995.3312 18 Customer Complaints 223.200743 15.522926 14.3787803 1.9462E-18 191.935965 254.465521 191.935965 254.465521 19 Avg. Workers 1058.17244 267.71335 3.95263231 0.00027022 518.970074 1597.37481 518.970074 1597.37481 20 21 22 Required: 1. For upcoming customer service months, the company will apply overhead using which formula? ($222.211 * Customer Complaints) + ($1,052.086 Average Workers) ($223.201 * Customer Complaints) + ($1,058.172 * Average Workers) $14,396.291 + ($223.201 * Customer Complaints) + ($1,058.172 * Average Workers) $13,139.189 + ($222.211 x Customer Complaints) + ($1,052.086 * Average Workers) 2. How many months are we using to estimate overhead costs for the service center? 49 47 46 48 3. Based on the results of the cost driver analysis for Thrustmaster, which cost drivers should be used? Customer Call Minutes and Customer Complaints Customer Call Minutes and Average Workers Customer Complaints and Average Workers Average Workers 4. The dependent variable in the regression in our cost driver analysis is: Company Sales Overhead Cost per Delivery Total Overhead Cost per Month Total Overhead Cost for the Period Studied 5. If the number of customer complaints for a month is 50 and the average workers is 30, what is the estimated overhead cost per month for Thrustmaster? $57,301.50 $42,905.10 $14,396.29 $39,800.11 A B C D E 1 J K L M N o P Q 1 Customer Service Months 2 1 2 3 Actual vs. Estimated Overhead Costs per Month 60,000 4 50,000 3 4 5 6 7 8 9 10 11 12 13 40,000 5 6 7 8 8 9 9 10 30,000 20,000 10,000 0 10000 20000 30000 40000 50000 60000 14 15 16 17 18 19 20 21 22 23 24 25 26 27 28 29 30 31 11 12 13 14 15 16 17 18 19 20 21 22 23 24 25 26 27 28 29 30 Total Overhead Cost per Month 39,056 54,998 35,124 39,004 37,926 41,633 40,861 39,610 48,731 37,627 43,172 36,580 51,242 47,324 49,101 34,395 40,347 43,866 46,802 48,502 36,542 52.427 49,883 42,331 40,472 35,177 36,491 31,232 47,675 48,475 37,687 36,092 40,411 47,606 40,070 50,142 43,156 Customer Call Minutes Customer Complaints Avg. Workers 1763 44 13 2396 96 15 2313 46 12 1611 40 14 1912 48 15 2342 47 13 1258 42 13 1499 50 15 2070 83 14 1992 50 14 1887 47 14 1938 48 12 2428 97 14 1317 88 11 1215 81 13 1261 42 13 1637 41 13 1625 81 12 1406 94 13 1479 99 15 1626 41 14 2481 99 14 2007 80 12 2181 87 11 1694 42 15 2257 45 12 1624 41 12 1241 41 11 2469 99 11 1389 93 14 1648 41 14 1400 47 12 1863 47 15 1219 81 15 2280 46 13 1856 93 15 1349 45 14 F G . Company Sales Estimated Actual 3,111,810 37973.37 39,056 3,553,530 51696.17 54,998 3,367,950 37361.6 35.124 1,786,160 38138.74 39,004 1,697,550 40982.52 37,926 3,851,560 38642.97 41,633 1,262,360 37526.97 40,861 2,362,780 41428.92 39,610 1,563,810 47736.38 48,731 3,686,350 40370.75 37,627 2,255,310 39701.15 43,172 2,786,040 37808 36,580 1,297,430 50861.2 51,242 2,111,800 45677.87 47,324 1,056,330 46231.81 49,101 1,967,380 37526.97 34,395 3,745,960 37303.77 40,347 863,940 45173.64 43,866 1,632,460 49133.42 46,802 2,664,030 52365.77 48,502 965,550 38361.94 36,542 3,659,060 51307.6 52,427 2,829,010 44950.43 49.883 2,093,310 45454.67 42,331 1,370,160 39643.31 40,472 2,648,390 37138.4 35,177 3,130,220 36245.6 36,491 3,260,620 35187.42 31,232 3,093,120 48133.08 47,675 3,923,930 49968.39 48,475 3,532,600 38361.94 37,687 1,407,770 37584.8 36,092 3,544,220 40759.32 40,411 1,804,470 48348.15 47,606 2,986,740 38419.77 40,070 1,937,110 51026.56 50,142 3,846,060 39254.74 43,156 32 33 31 32 33 34 35 36 37 38 34 35 36 37 42,701 49,216 39 40 41 42 43 45,428 80 88 98 92 49 44 45 46 47 48 49 50 38 39 40 41 42 43 44 45 46 47 48 46,698 42,436 38,806 44,215 50,796 36,588 46,471 53,721 1205 1314 1969 1832 2439 2332 1711 1905 2222 2108 1922 11 12 11 11 13 14 14 11 12 14 14 2,696,670 43892.26 1,329,160 46736.04 2,712,170 47909.88 1,330,060 46570.67 3,641,900 39089.38 3,174,290 39701.15 3,551,590 48405.98 3,025,140 47240.28 2,936,070 36915.2 3,676,490 47959.58 2,601,950 50637.99 42,701 49,216 45,428 46,698 42,436 38,806 44,215 50,796 36,588 46,471 53,721 86 95 44 84 96 A20 2 x fx Avg. Workers B D E F G H 1 SUMMARY OUTPUT 2 3 Regression Statistics 4 Multiple R 0.91011727 5 R Square 0.82831344 6 Adjusted R Square 0.8123426 7 Standard Error 2513.88333 8 Observations 48 9 10 ANOVA 11 df SS MS F Significance F 12 Regression 4 1311043528 327760882 51.8641046 6.6251E-16 13 Residual 43 271743204 6319609.39 14 Total 47 1582786732 15 16 Coefficients tandard Error t Stat P-value Lower 95% Upper 95% Lower 95.0% Upper 95.0% 17 Intercept 13139.1891 4139.24252 3.17429796 0.00277485 4791.611 21486.7672 4791.611 21486.7672 18 Customer Call Minutes 0.72864764 0.99495993 0.73233868 0.46793505 -1.2778803 2.73517556 -1.2778803 2.73517556 19 Customer Complaints 222.211036 16.0316601 13.8607627 1.8248E-17 189.880112 254.54196 189.880112 254.54196 20 Avg. Workers 1052.08594 271.897569 3.86942016 0.00036523 503.752229 1600.41964 503.752229 1600.41964 21 Company Sales 3.2545E-05 0.00043055 0.07558769 0.94009772 -0.0008358 0.00090084 -0.0008358 0.00090084 22 23 24 B28 A B D E F G H 1 SUMMARY OUTPUT 2 3 Regression Statistics 4 Multiple R 0.90862601 5 R Square 0.82560123 6 Adjusted R Square 0.81785017 7 Standard Error 2476.71853 8 Observations 48 9 10 ANOVA 11 df SS MS F Significance F 12 Regression 2 1306750672 653375336 106.514671 8.6045E-18 13 Residual 45 276036060 6134134.66 14 Total 47 1582786732 15 16 Coefficients Standard Error t Stat P-value Lower 95% Upper 95% Lower 95.0% Upper 95.0% 17 Intercept 14396.2909 3772.91469 3.8156948 0.00041177 6797.25068 21995.3312 6797.25068 21995.3312 18 Customer Complaints 223.200743 15.522926 14.3787803 1.9462E-18 191.935965 254.465521 191.935965 254.465521 19 Avg. Workers 1058.17244 267.71335 3.95263231 0.00027022 518.970074 1597.37481 518.970074 1597.37481 20 21 22 Required: 1. For upcoming customer service months, the company will apply overhead using which formula? ($222.211 * Customer Complaints) + ($1,052.086 Average Workers) ($223.201 * Customer Complaints) + ($1,058.172 * Average Workers) $14,396.291 + ($223.201 * Customer Complaints) + ($1,058.172 * Average Workers) $13,139.189 + ($222.211 x Customer Complaints) + ($1,052.086 * Average Workers) 2. How many months are we using to estimate overhead costs for the service center? 49 47 46 48 3. Based on the results of the cost driver analysis for Thrustmaster, which cost drivers should be used? Customer Call Minutes and Customer Complaints Customer Call Minutes and Average Workers Customer Complaints and Average Workers Average Workers 4. The dependent variable in the regression in our cost driver analysis is: Company Sales Overhead Cost per Delivery Total Overhead Cost per Month Total Overhead Cost for the Period Studied 5. If the number of customer complaints for a month is 50 and the average workers is 30, what is the estimated overhead cost per month for Thrustmaster? $57,301.50 $42,905.10 $14,396.29 $39,800.11