A B C D E F G H I J K L M N P Q R S T U # of roles to get
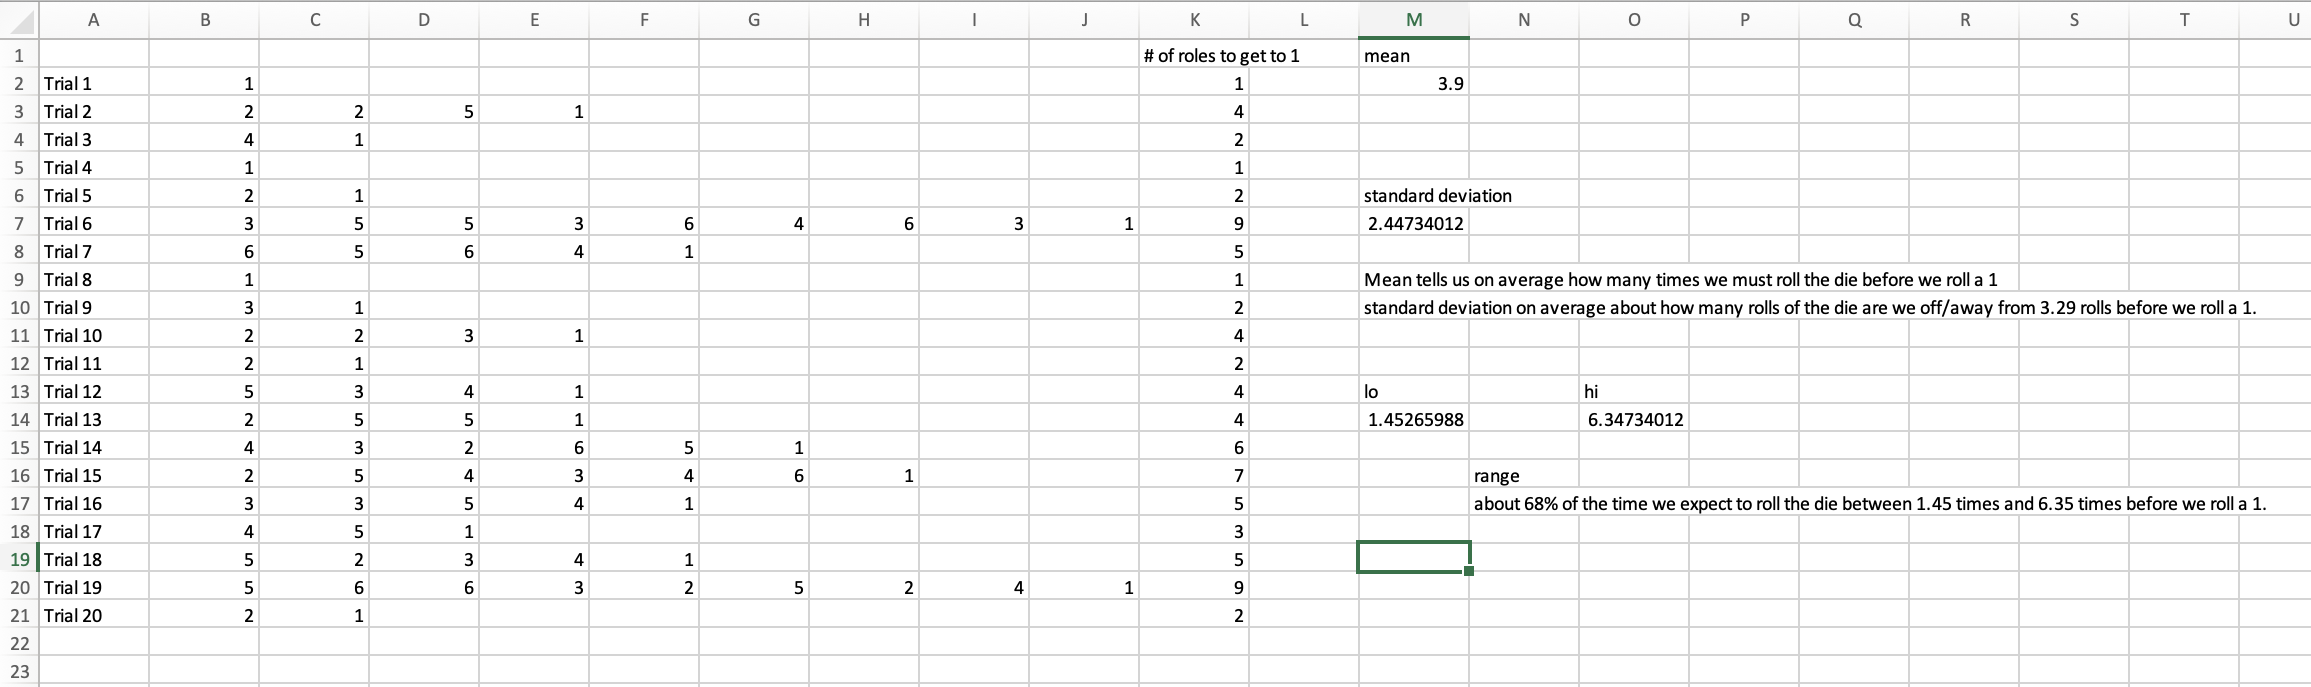
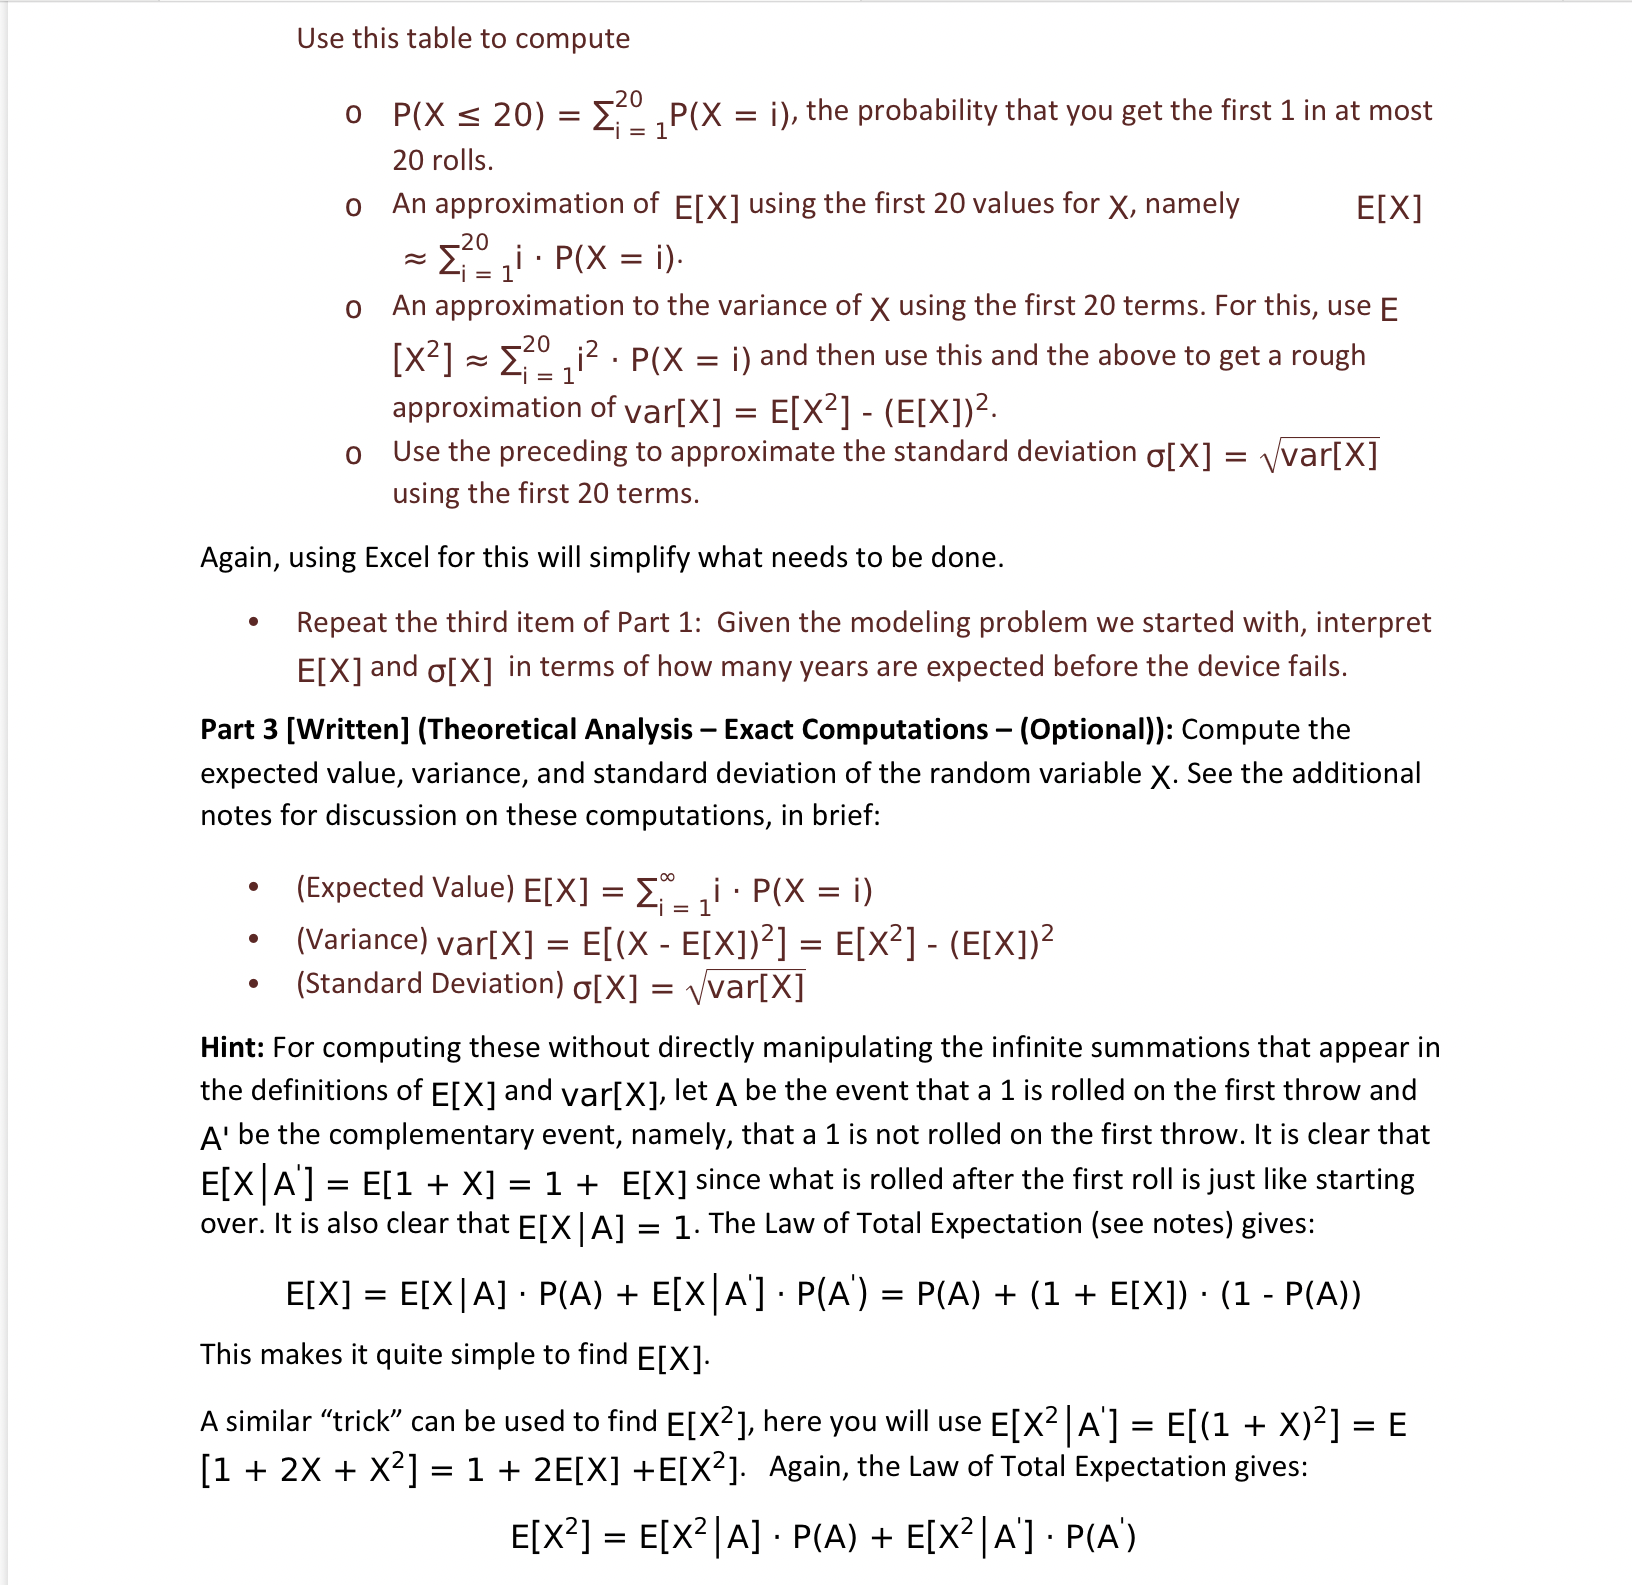
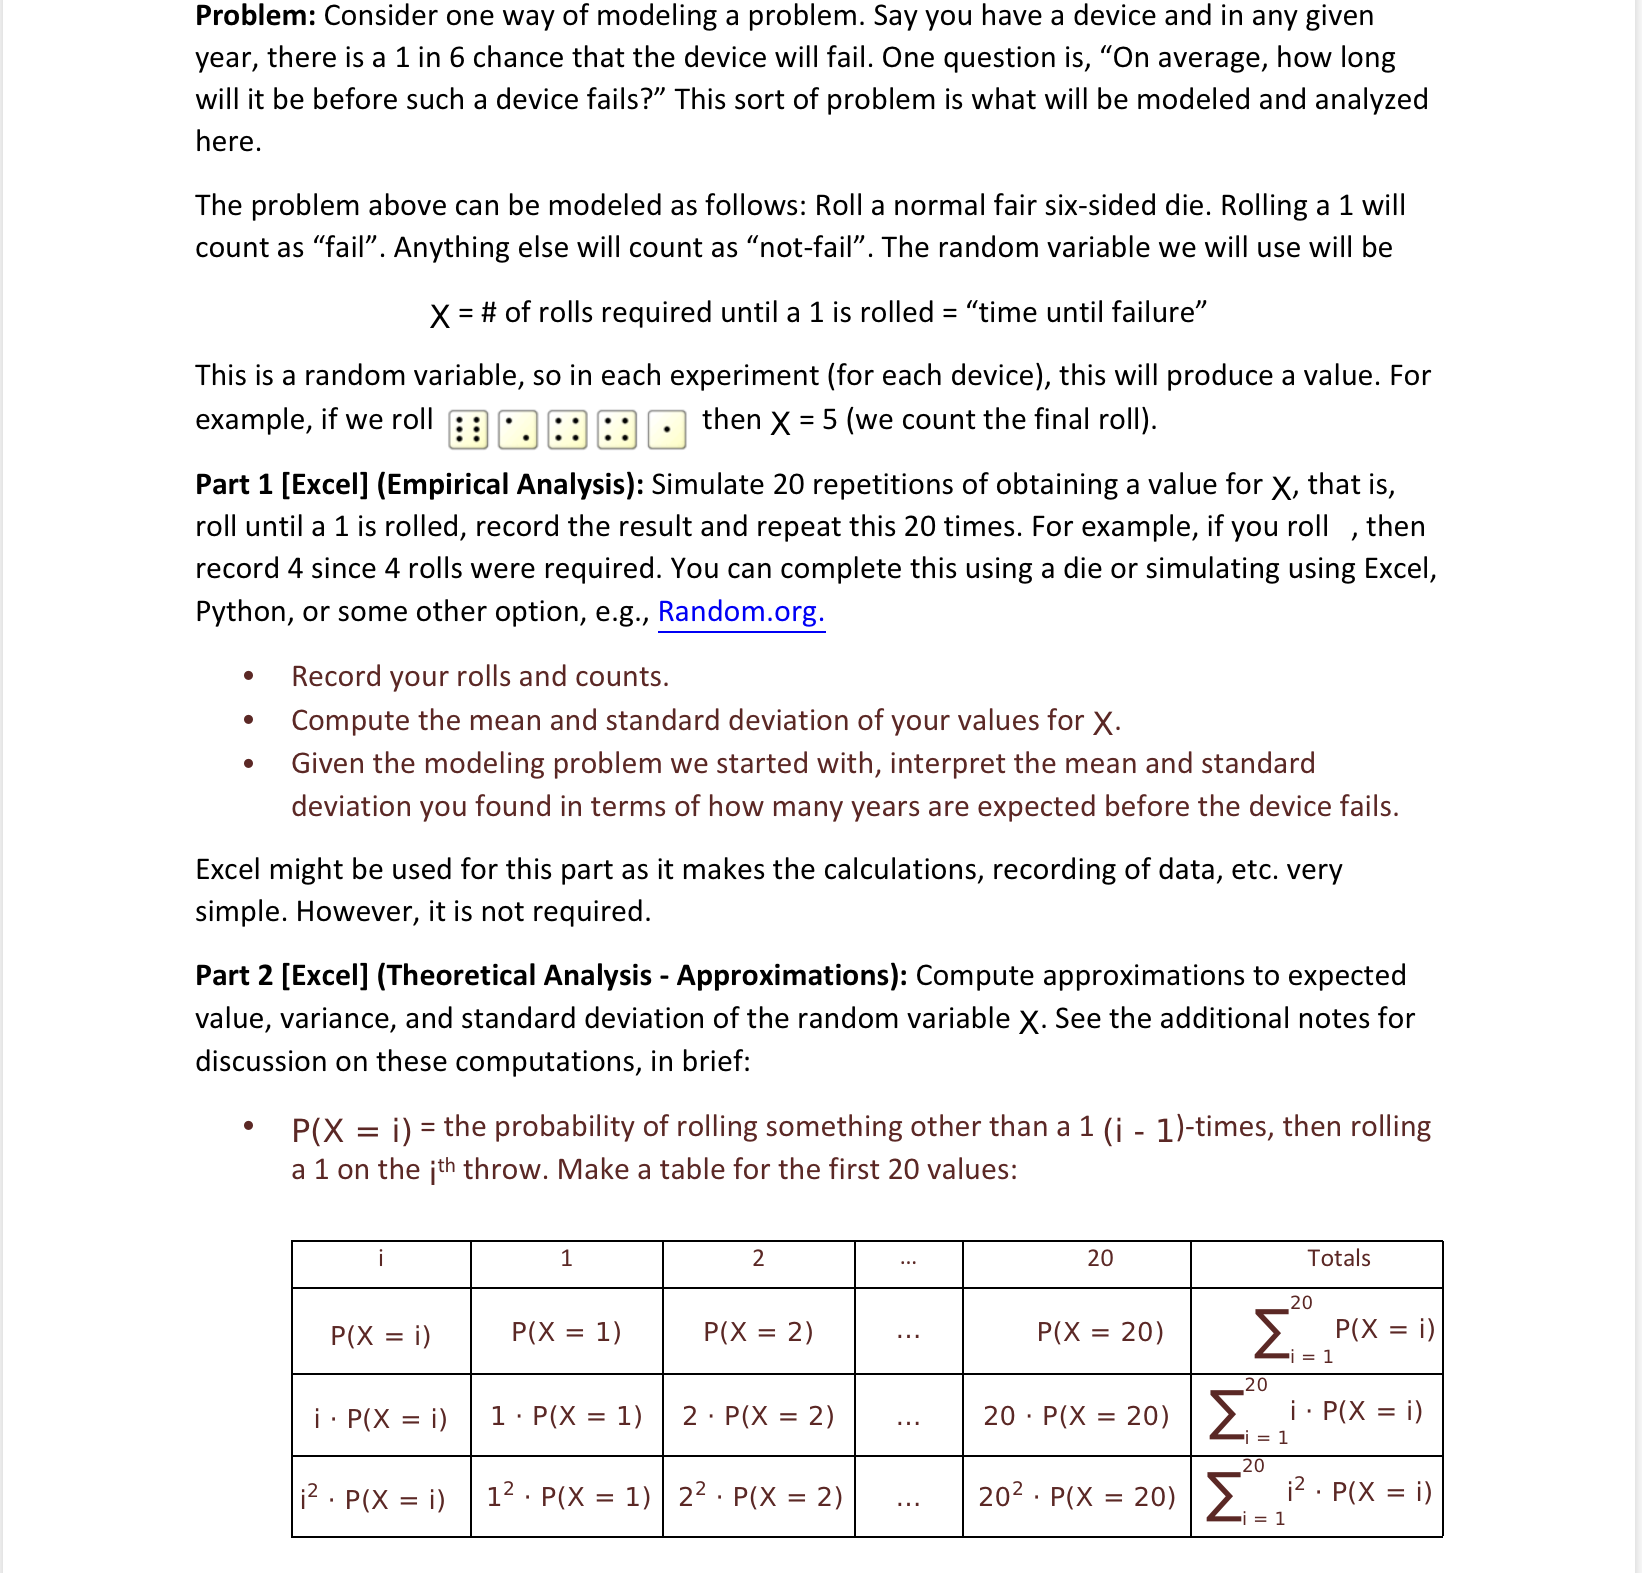
A B C D E F G H I J K L M N P Q R S T U # of roles to get to 1 mean 2 Trial 1 1 3.9 W Trial 2 5 4 P N 4 Trial 3 Trial 4 6 Trial 5 standard deviation 7 Trial 6 UI UI P 4 6 3 1 2.44734012 a U - W 8 Trial 7 9 Trial 8 Mean tells us on average how many times we must roll the die before we roll a 1 10 Trial 9 standard deviation on average about how many rolls of the die are we off/away from 3.29 rolls before we roll a 1. 11 Trial 10 3 JO AANANHUY NUUAW NA NUNN WHO WNHANK 12 Trial 11 13 Trial 12 lo hi 14 Trial 13 1.45265988 6.34734012 15 Trial 14 16 Trial 15 HAU 1 range OW HUI A NUA 17 Trial 16 about 68% of the time we expect to roll the die between 1.45 times and 6.35 times before we roll a 1. 18 Trial 17 NOU WUT V 19 Trial 18 20 Trial 19 5 2 4 1 21 Trial 20 22 23Problem: Consider one way of modeling a problem. Say you have a device and in any given year, there is a 1 in 6 chance that the device will fail. One question is, "On average, how long will it be before such a device fails?\" This sort of problem is what will be modeled and analyzed here. The problem above can be modeled as follows: Roll a normal fair sixsided die. Rolling a 1 will count as "fail". Anything else will count as "not-fail". The random variable we will use will be X = # of rolls required until a 1 is rolled = "time until failure\" This is a random variable, so in each experiment (for each device), this will produce a value. For example, if we roll E] E] E] E] then X = 5 (we count the final roll). Part 1 [Excel] (Empirical Analysis): Simulate 20 repetitions of obtaining a value for x, that is, roll until a 1 is rolled, record the result and repeat this 20 times. For example, if you roll , then record 4 since 4 rolls were required. You can complete this using a die or simulating using Excel, Python, or some other option, e.g., Random.org. - Record your rolls and counts. - Compute the mean and standard deviation of your values for X. - Given the modeling problem we started with, interpret the mean and standard deviation you found in terms of how many years are expected before the device fails. Excel might be used for this part as it makes the calculations, recording of data, etc. very simple. However, it is not required. Part 2 [Excel] (Theoretical Analysis - Approximations): Compute approximations to expected value, variance, and standard deviation of the random variable X. See the additional notes for discussion on these computations, in brief: ' P()( = i) = the probability of rolling something other than a 1 (i _ 1)times, then rolling a 1 on the ith throw. Make a table for the first 20 values: Use this table to compute o P(X - 20) = E,_ P(X = i), the probability that you get the first 1 in at most 20 rolls. 0 An approximation of E[X] using the first 20 values for X, namely E[X] 520 i . P(X = 1). o An approximation to the variance of X using the first 20 terms. For this, use E [x2] = [- ,i2 . P(X = i) and then use this and the above to get a rough approximation of var[X] = E[X2] - (E[X])2. o Use the preceding to approximate the standard deviation o[X] = Vvar[X] using the first 20 terms. Again, using Excel for this will simplify what needs to be done. . Repeat the third item of Part 1: Given the modeling problem we started with, interpret E[X] and o[X] in terms of how many years are expected before the device fails. Part 3 [Written] (Theoretical Analysis - Exact Computations - (Optional)): Compute the expected value, variance, and standard deviation of the random variable X. See the additional notes for discussion on these computations, in brief: (Expected Value) E[X] = Z; _1i . P(X = i) (Variance) var[X] = E[(X - E[X])2] = E[X2] - (E[X])2 (Standard Deviation) o[X] = Vvar[X] Hint: For computing these without directly manipulating the infinite summations that appear in the definitions of E[X] and var[X], let A be the event that a 1 is rolled on the first throw and A' be the complementary event, namely, that a 1 is not rolled on the first throw. It is clear that E[X | A'] = E[1 + X] = 1 + E[X] since what is rolled after the first roll is just like starting over. It is also clear that E[X | A] = 1. The Law of Total Expectation (see notes) gives: E[X] = E[X | A] . P(A) + E[X A'] . P(A') = P(A) + (1 + E[X]) . (1 - P(A)) This makes it quite simple to find E[X]. A similar "trick" can be used to find E[X2], here you will use E[X2 | A'] = E[(1 + X)2] = E [1 + 2X + X2] = 1 + 2E[X] +E[X2]. Again, the Law of Total Expectation gives: E[X2] = E[X2 | A] . P(A) + E[X2 | A'] . P(A')
Step by Step Solution
There are 3 Steps involved in it
Step: 1
Get Instant Access to Expert-Tailored Solutions
See step-by-step solutions with expert insights and AI powered tools for academic success
Step: 2
Step: 3
Ace Your Homework with AI
Get the answers you need in no time with our AI-driven, step-by-step assistance