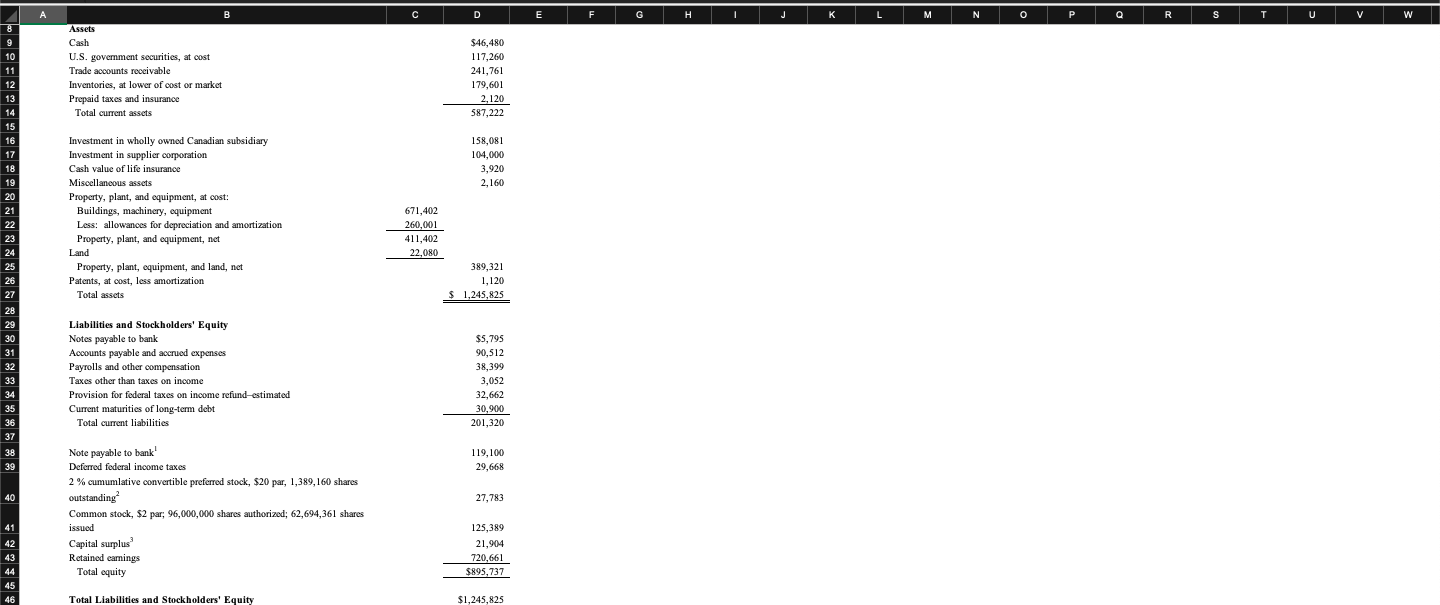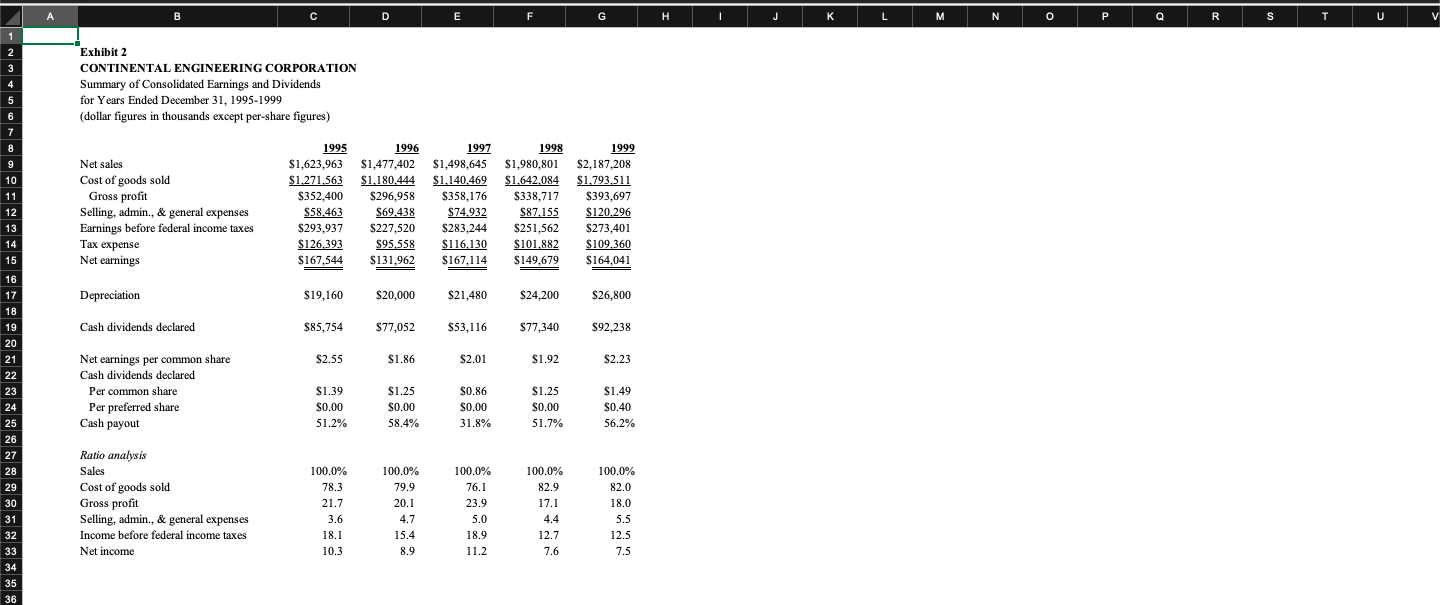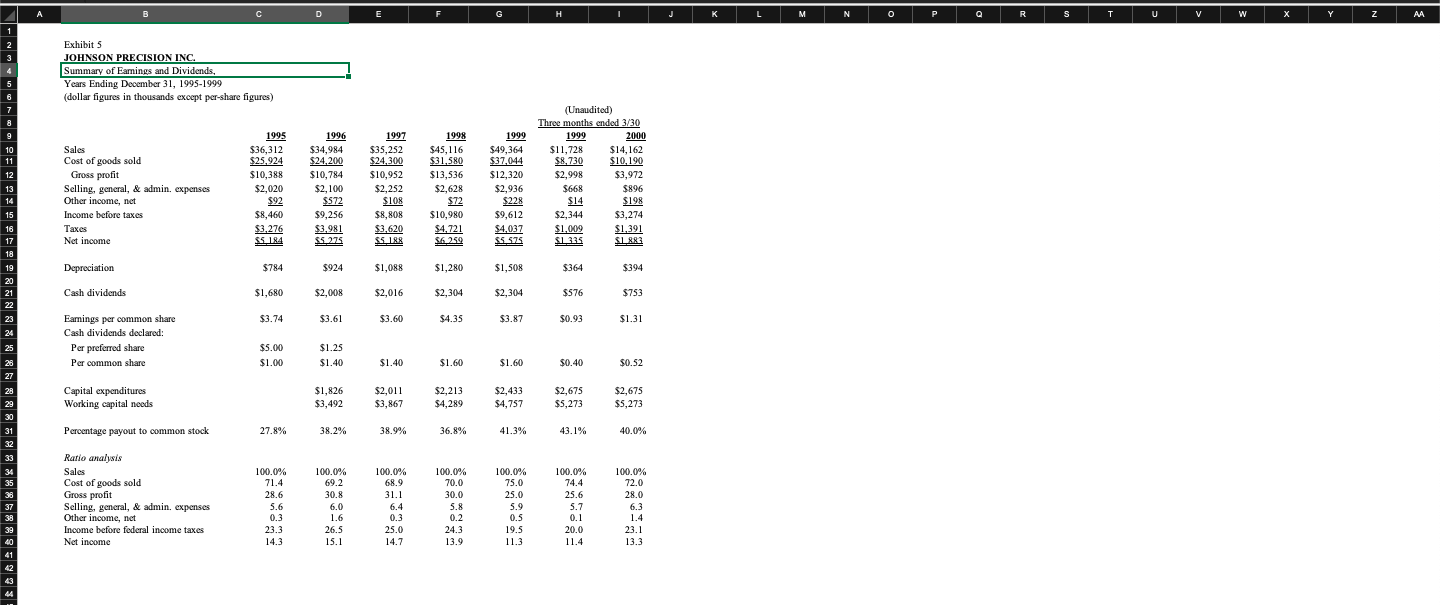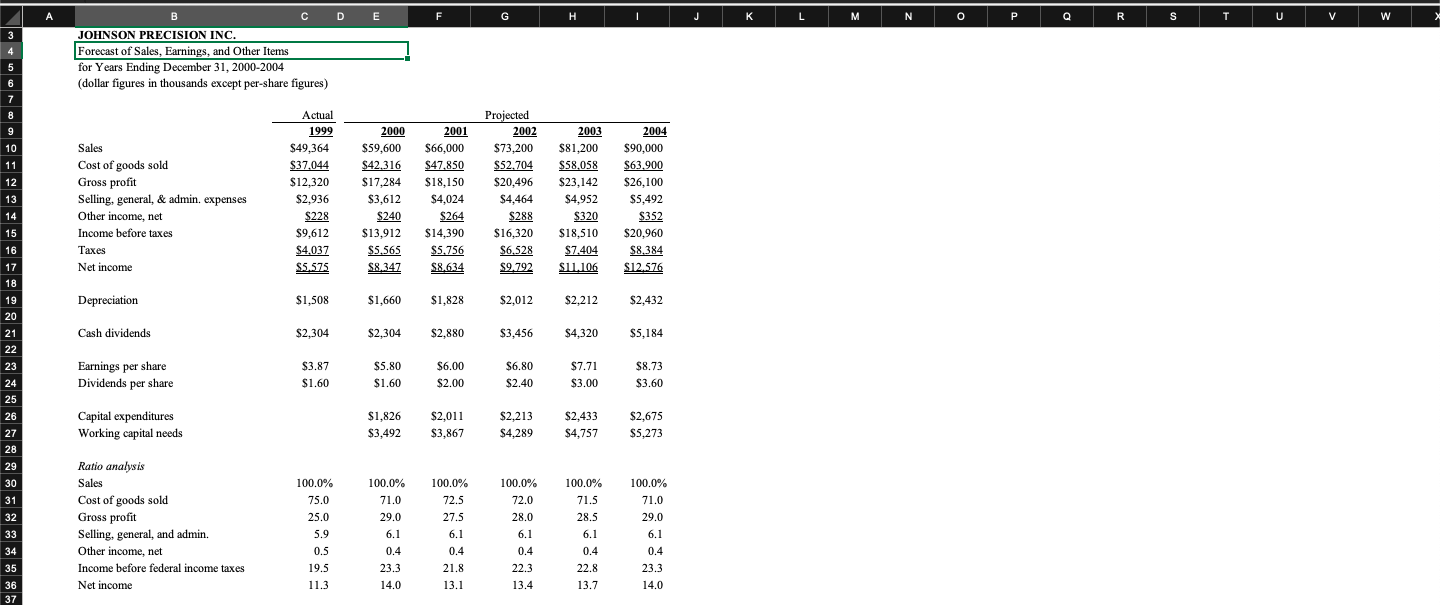


A B c D E F G H K M N o P R S U V W Assets Cash $46,480 U.S. government securities, at cost 117,260 Trade accounts receivable 241, 761 Inventories, at lower of cost or market 179,601 Prepaid taxes and insurance 2,120 Total current asset 587,222 Investment in wholly owned Canadian subsidiary 158,081 Investment in supplier corporation 104,000 Cash value of life insurance 3,920 Miscellaneous assets 2,160 Property, plant, and equipment, at cost: Buildings, machinery, equipment 671,402 Less: allowances for depreciation and amortization 260,001 Property, plant, and equipment, net 411,402 Land 22,080 Property, plant, equipment, and land, net 389,321 Patents, at cost, less amortization 1,120 Total assets 1,245,825 Liabilities and Stockholders' Equity Notes payable to bank $5,795 Accounts payable and accrued expenses 90,512 Payrolls and other compensation 38,399 Taxes other than taxes on income 3,052 Provision for federal taxes on income refund-estimated 32,662 Current maturities of long-term debt 30,900 Total current liabilities 201,320 Note payable to bank 119, 100 39 Deferred federal income taxes 29,668 2 % cumumlative convertible preferred stock, $20 par, 1,389, 160 shares 40 outstanding 27,783 Common stock, $2 par; 96,000,000 shares authorized; 62,694,361 shares issued 125,389 Capital surplus' 21,904 Retained earnings 720,661 Total equity $895,737 Total Liabilities and Stockholders' Equity $1,245,825B c D E F G H K M N O P Q R S T U Exhibit 2 CONTINENTAL ENGINEERING CORPORATION Summary of Consolidated Earnings and Dividends for Years Ended December 31, 1995-1999 (dollar figures in thousands except per-share figures) 1995 1996 1997 1998 1999 Net sales $1,623,963 $1,477,402 $1,498,645 $1,980,801 $2,187,208 Cost of goods sold $1.271.563 $1.180.444 $1.140.469 $1.642.084 $1.793.511 Gross profit $352,400 $296,958 $358,176 $338,717 $393,697 12 Selling, admin., & general expenses $58.463 $69.438 $74.932 $87.155 $120.296 Earnings before federal income taxes $293,937 $227,520 $283,244 $251,562 $273,401 Tax expense $126.393 $95.558 $116.130 $101.882 $109.360 15 Net earnings $167,544 $131,962 $167,114 $149,679 $164,041 16 17 Depreciation $19,160 $20,000 $21,480 $24,200 $26,800 18 Cash dividends declared $85,754 $77,052 $53,116 $77,340 $92,238 20 Net earnings per common share $2.55 $1.86 $2.01 $1.92 $2.23 Cash dividends declared Per common share $1.39 $1.25 $0.86 $1.25 $1.49 24 Per preferred share $0.00 $0.00 $0.00 $0.00 $0.40 25 Cash payout 51.2% 58.4% 31.8% 51.7% 56.2% 26 Ratio analysis 28 Sales 100.0% 100.0% 100.0% 100.0% 100.0% 29 Cost of goods sold 78.3 79.9 76.1 82.9 82.0 30 Gross profit 21.7 20.1 23.9 17.1 18.0 31 Selling, admin., & general expenses 3.6 4.7 5.0 4.4 5.5 32 Income before federal income taxes 18.1 15.4 18.9 12.7 12.5 33 Net income 10.3 8.9 11.2 7.6 7.5 34 35 36B C D E F G H K M N O P Q R S T Exhibit 3 CONTINENTAL ENGINEERING CORPORATION Forecast of Sales, Earnings, and Other Items for the Years Ending December 31, 1999-2004 (dollar figures in thousands except per-share figures) Actual Projected 1999 2000 2001 2002 2003 2004 Sales $2,187,208 $2,329,373 $2,480,785 $2,642,037 $2,813,769 $2,996,658 Cost of goods sold $1.793.511 $1.910.086 $2.034.244 $2.166.470 $2.307.291 $2.457.260 Gross profit $393,697 $419,287 $446,541 $475,567 $506,478 $539,398 Selling, general, & admin. expenses $120.296 $125.786 $131.482 $140.028 $155.826 Income before tax $273,401 $146.316 $293,501 $315,060 $335,539 $360,162 $383,572 Tax expense $109,360 $117.400 $126.024 $134.215 $144.065 $153.429 16 Net income $164,041 $176,101 $189,036 $201,323 $216,097 $230,143 Depreciation $26,800 $27,950 $29,770 $31,700 $33,170 $35,960 19 20 Cash dividends $92,238 $102,083 $108,715 $115,780 $125,185 $133,314 21 22 Earnings per share' $2.23 $2.39 $2.54 $2.71 $2.93 $3.12 23 Dividends per share of common stock' $1.49 $1.58 $1.69 $1.80 $1.94 $2.07 24 Dividends per share of preferred stock $0.40 25 26 Ratio analysis Sales 100.0% 100.0% 100.0% 100.0% 100.0% 100.0% 28 Cost of goods sold 82.0 82.0 82.0 82.0 82.0 82.0 29 Gross profit 18.0 18.0 18.0 18.0 18.0 18.0 30 Sell., gen., & admin. 5.5 5.4 5.3 5.3 5.2 5.2 31 Income before tax 12.5 12.6 12.7 12.7 12.8 12.8 32 Net income 7.5 6.6 6.6 6.6 6.7 6.7 33 34 ' 62,694,361 common shares in 1999. Thereafter, 64,416,919 shares reflecting conversion of the preferred stock. 35 21,389,160 preferred shares in 1999. Conversion into 1, 722,558 shares of common stock assumed in 2000. 36A B C D E F G H K M N O P Q R S T (dollar figures in thousands) Assets Cash $1,884 U.S. Treasury tax notes and other Treasury obligations 9,328 Due from U.S. Government 868 Accounts receivable net* 2,316 12 Inventories, at lower of cost or market* * 6,888 Other current assets 116 Total current assets $21,400 Invest--ments 1,768 Plant, property, and equipment, at cost Land* *+ 92 Buildings 6,240 19 Equipment* *+ 18,904 Less: allowance for depreciation 7,0561 $18, 180 Construction in process 88 Total plant, property, and equipment, net $18,268 Patents 156 Cash value of life insurance 376 Deferred assets 156 Total assets $42 124 Liabilities and Stockholders' Equity Accounts payable $2,016 Wages and salaries accrued 504 Employees' pension cost accrued 208 Tax accrued 72 Dividends payable 560 Provision for federal income tax 1,200 36 Total current liabilities $4,560 Deferred federal income tax 800 Common stock, par 50 cents, authorized and outstanding 1,440,-000 shares 720 Capital surplus 7,68 Earned surplus 28,364 Total equity $36,764 Total liabilities and stockholders' equity $42 124 Current ratio 4.69 Quick ratio 3.16B C D E G M N P Q R S U V W Z AA Exhibit 5 JOHNSON PRECISION INC. Summary of Earnings and Dividends, Years Ending December 31, 1995-1999 (dollar figures in thousands except per-share figures) (Unaudited) Three months ended 3/30 1995 1996 1997 1998 1999 Sales 1999 2000 Cost of goods sold $36,312 $34,984 $35,252 $45,116 $25,924 $49,364 $24,200 $24.300 $31,580 $11,728 $14, 162 $37.044 Gross profit $10,388 $10,784 $8,730 $10,952 $13,536 $10,190 $12,320 $2,998 $3,972 Selling, general, & admin. expenses $2,020 $2, 100 Other income, net $2,252 $2,628 $2,936 $92 $668 $896 $572 $108 $72 $228 Income before taxes $14 $198 $8, 460 $9,256 $8,808 $10,980 Taxes $9,612 $2,344 $3,274 $3.276 $3.981 $3,620 Net income $5.275 $4.721 $4,037 $5 184 $5 188 $1,009 $1,391 $6 250 $5.575 $1 335 $1 883 Depreciation $784 $924 $1,088 $1,280 $1,508 $364 $394 Cash dividends $1,680 $2,008 $2,016 $2,304 $2,304 $576 $753 Earnings per common share $3.74 $3.61 $3.60 $4.35 $3.87 $0.93 Cash dividends declared: $1.31 Per preferred share $5.00 $1.25 Per common share $1.00 $1.40 $1.40 $1.60 $1.60 $0.40 $0.52 Capital expenditures $1,826 $2,011 $2,213 $2,433 Working capital needs $2,675 $2,675 $3,492 $3,867 $4,289 $4,757 $5,273 $5,273 Percentage payout to common stock 27.8% 38.2% 38.9% 36.8% 41.3% 43.1% 40.0% Ratio analysis Sales 100.0% 100.0% 100.0% Cost of goods sold 100.0% 71.4 100.0% 69.2 100.0% 100.0% 68.9 Gross profit 70.0 75.0 74.4 72.0 28.6 30.8 31.1 5.6 30.0 Selling, general, & admin. expenses 25.0 6.0 Other income, net 6.4 5.8 0.3 5.9 25.6 28.0 1.6 0.2 S.7 0.3 6.3 O.S Income before federal income taxes 23.3 26.5 25.0 24.3 1.4 Net income 19.5 20.0 14.3 15.1 23.1 14.7 13.9 11.3 11.4 13.3B C D E F G H K M N O P Q R S T U V W JOHNSON PRECISION INC. Forecast of Sales, Earnings, and Other Items for Years Ending December 31, 2000-2004 (dollar figures in thousands except per-share figures) Actual Projected 1999 2000 2001 2002 2003 2004 Sales $49,364 $59,600 $66,000 $73,200 $81,200 $90,000 Cost of goods sold $37.044 $42.316 $47.850 $52.704 $58.058 $63.900 Gross profit $12,320 $17,284 $18,150 $20,496 $23,142 $26,100 Selling, general, & admin. expenses $2,936 $3,612 $4,024 $4.464 $4,952 $5,492 Other income, net $228 $240 $264 $288 $320 $352 Income before taxes $9,612 $13,912 $14,390 $16,320 $18,510 $20,960 Taxes $4.037 $5.565 $5.756 $6.528 $7.404 $8.384 Net income $5.575 $8.347 $8.634 $9 792 $11.106 $12.576 18 19 Depreciation $1,508 $1,660 $1,828 $2,012 $2,212 $2,432 20 21 Cash dividends $2,304 $2,304 $2,880 $3,456 $4,320 $5.184 22 23 Earnings per share $3.87 $5.80 $6.00 $6.80 $7.71 $8.73 24 Dividends per share $1.60 $1.60 $2.00 $2.40 $3.00 $3.60 25 26 Capital expenditures $1,826 $2,011 $2,213 $2,433 $2,675 27 Working capital needs $3,492 $3,867 $4.289 $4,757 $5,273 28 29 Ratio analysis 30 Sales 100.0% 100.0% 100.0% 100.0% 100.0% 100.0% 31 Cost of goods sold 75.0 1.0 72.5 72.0 71.5 1. 32 Gross profit 25.0 29.0 27.5 28.0 28.5 29.0 33 Selling, general, and admin. 5.9 6.1 6.1 6.1 6.1 6.1 34 Other income, net 0.5 0.4 0.4 0.4 0.4 0.4 35 Income before federal income taxes 19.5 23.3 21.8 22.3 22.8 23.3 36 37 Net income 11.3 14.0 13.1 13.4 13.7 14.0B C D E F G H K M N O P Q R S T U V W X Z AA Exhibit 7 Market Prices of JPC and Continental Engineering Corporation JPC Continental Engineering Common Stock Common Stock Preferred Stock High Low Close High Low Close High Low 1995 $16.25 $8.75 $15.00 $12.31 $10.06 $11.88 1996 24.75 14.00 22.63 14.37 11.77 13.16 1997 25.00 20.00 22.25 12.82 9.28 11.13 12 13 1998 Quarter Ended: March 31 24.38 20.75 21.50 14.13 12.83 13.96 15 June 30 22.75 20.38 21.00 13.70 12.05 11.79 16 September 30 22.75 20.38 21.50 12.83 10.49 11.27 December 31 24.38 20.13 21.00 12.40 11.27 11.88 18 19 1999 Quarter Ended: 20 March 31 23.50 20.00 21.75 11.60 10.21 10.67 13.61 12.22 June 30 23.63 19.88 22.00 11.60 10.90 10.90 13.15 12.05 22 September 30 22.75 20.00 22.50 13.61 11.14 13.61 14.23 12.37 December 31 30.00 22.25 28.50 17.01 13.30 16.78 17.32 13.77 24 25 2000 Quarter Ended: 26 March 31 32.13 26.00 31.50 20.73 15.08 20.69 17.32 13.99 27 May 1, 2000 $39.75 $38.90 $39.75 $22.58 $18.31 $21.98 $17.63 $15.36 28 29 30A B C D E F G H K M N O P Q R S T U V Information on Peer Firms in the Industrial Machinery Sector Expected Price Growth Earnings Dividend Rate Ratio Beta Yield to 2005 Debt/Capital Cascade Corp. 10 Designs, manufactures and markets hydraulically- actuated products. 8.2x 0.85 4.00% 12.50% 49% 12 Curtiss-Wright Corporation Manufactures precision components in motion (42%) and flow (36%) control; 15 metal treatment (36% of sales). 10.3 0.65 1.4 10 DO 16 Flowserve Corp. Makes, designs, and markets fluid handling equipment (pumps, valves, and mechanical seals). 11 0.8 Nil 6.5 30 Idex Corp. Designs, manufactures, and markets industrial pumps, compressors, and a wide range of industrial products. 14.6 1.9 42 Roper Inds. Operates in three segments: industrial controls, fluid handling, and analytical instrumentation. 16.3 0.75 0.9 15.5 39 Tecumseh Products Manufactures compressors, condensers, pumps for commercial, industrial and agricultural applications. Foreign sales and exports totaled 43% of 1999 sales. 7 0.65 3 8.5 29 Thomas Inds. 30 Leading manufacturer of compressors and vacuum pumps. 10.7 0.85 1.6 16 Watts Industries Designs, manufactures, and sells and extensive 34 line of valves for the plumbing & heating and 35 water quality markets. 10.4 NMF 2.9 14 36 36 37 38 "NMF: not meaningful figure 39 Source: Value Line Investment Survey May 5, 2000