Answered step by step
Verified Expert Solution
Question
1 Approved Answer
A B C D E F G Price 1 Company Change ($) Part a Formula 2 | Aflac 0.80 Variance (to 4 decimals) #N/A 3
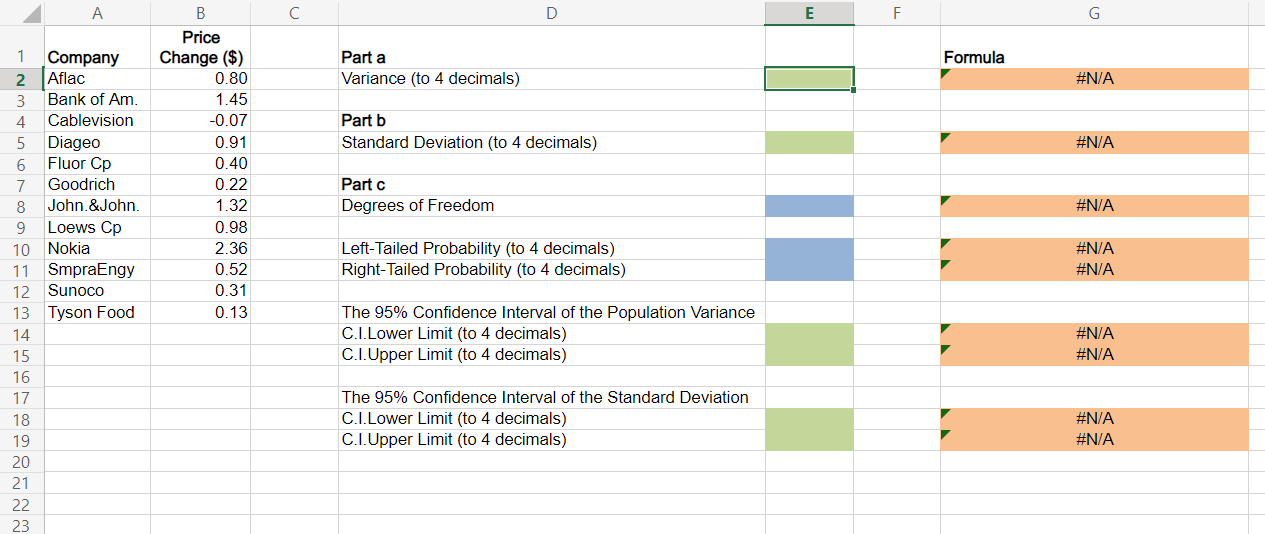
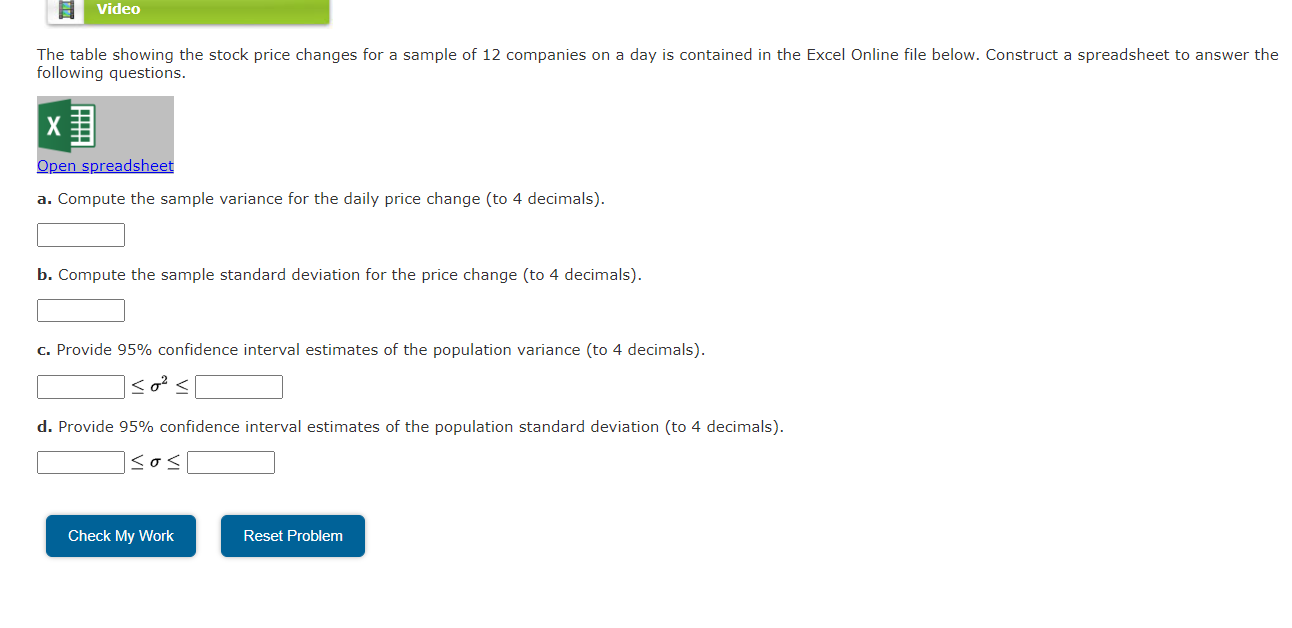
A B C D E F G Price 1 Company Change ($) Part a Formula 2 | Aflac 0.80 Variance (to 4 decimals) #N/A 3 Bank of Am. 1.45 4 Cablevision -0.07 Part b 5 Diageo 0.91 Standard Deviation (to 4 decimals) #N/A 6 Fluor Cp 0.40 7 Goodrich 0.22 Part c 8 John. & John. 1.32 Degrees of Freedom #N/A 9 Loews Cp 0.98 10 Nokia 2.36 Left-Tailed Probability (to 4 decimals) #N/A 11 SmpraEngy 0.52 Right-Tailed Probability (to 4 decimals) #N/A 12 Sunoco 0.31 13 Tyson Food 0.13 The 95% Confidence Interval of the Population Variance 14 C.I.Lower Limit (to 4 decimals) #N/A 15 C.I.Upper Limit (to 4 decimals) #N/A 16 17 The 95% Confidence Interval of the Standard Deviation 18 C.I.Lower Limit (to 4 decimals) #N/A 19 C.I.Upper Limit (to 4 decimals) #N/A 20 21 22 23Video The table showing the stock price changes for a sample of 12 companies on a day is contained in the Excel Online file below. Construct a spreadsheet to answer the following questions. X Open spreadsheet a. Compute the sample variance for the daily price change (to 4 decimals). b. Compute the sample standard deviation for the price change (to 4 decimals). c. Provide 95% confidence interval estimates of the population variance (to 4 decimals). 50' 5 d. Provide 95% confidence interval estimates of the population standard deviation (to 4 decimals). Check My Work Reset
Step by Step Solution
There are 3 Steps involved in it
Step: 1
Get Instant Access to Expert-Tailored Solutions
See step-by-step solutions with expert insights and AI powered tools for academic success
Step: 2
Step: 3
Ace Your Homework with AI
Get the answers you need in no time with our AI-driven, step-by-step assistance
Get Started