A, B, C, E, and F thank you so much
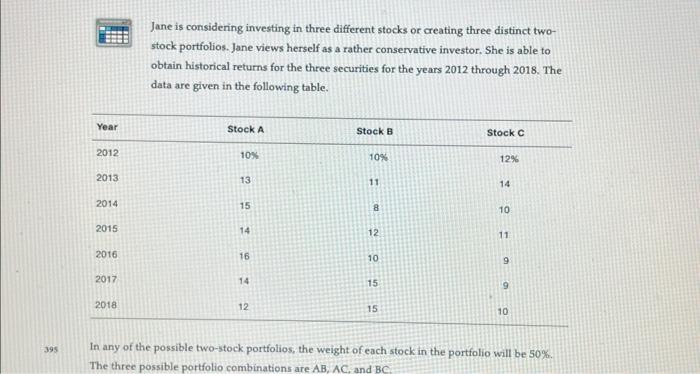
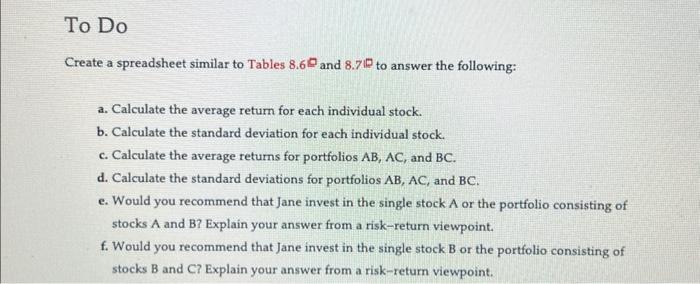
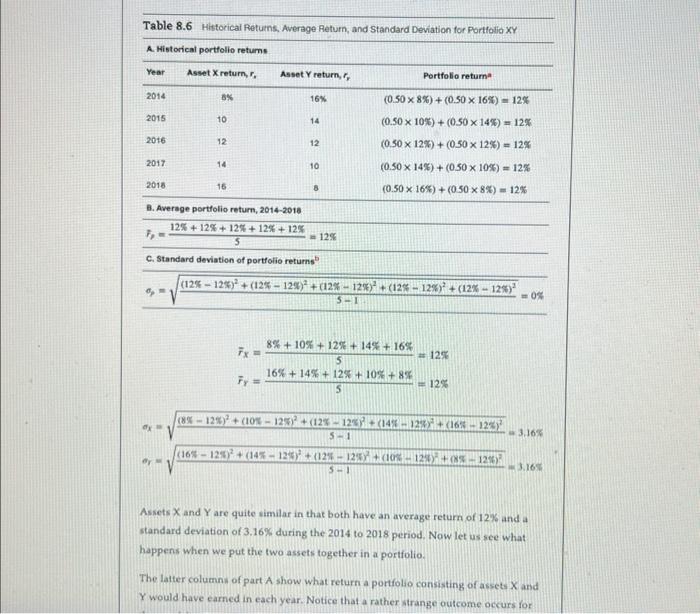
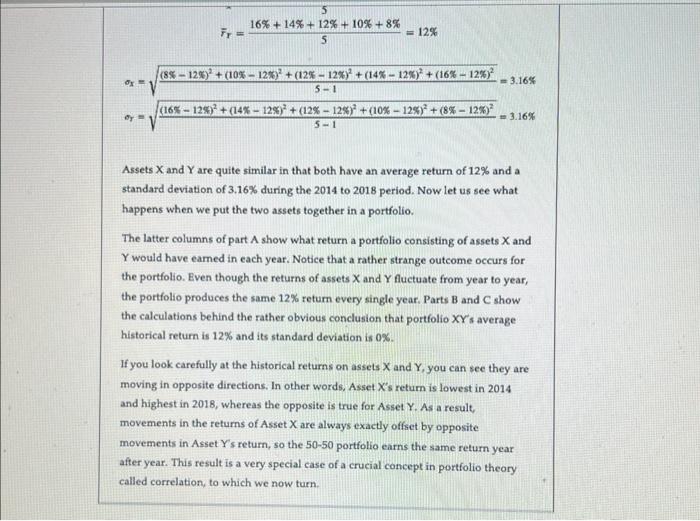
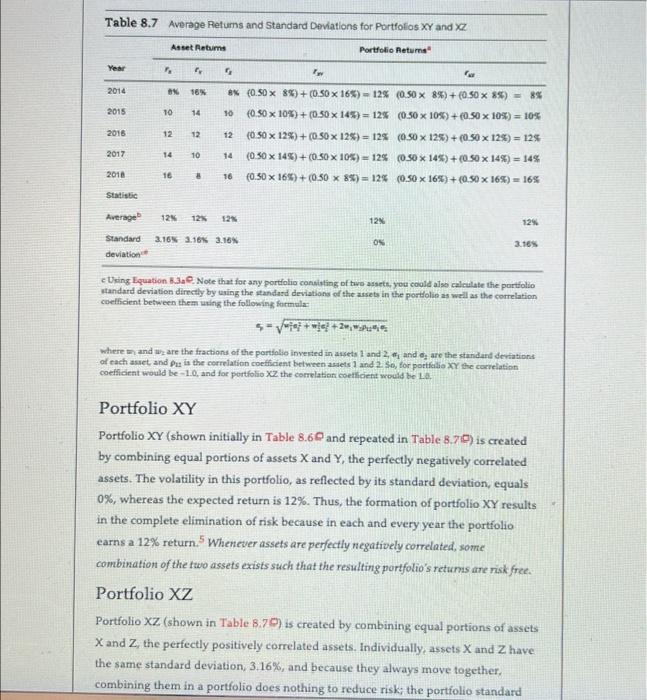
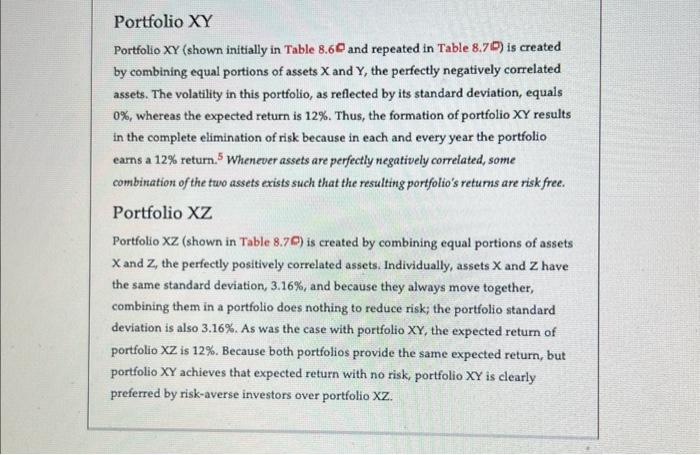
Jane is considering investing in three different stocks or creating three distinct twostock portfolios. Jane views herself as a rather conservative investor. She is able to obtain historical returns for the three securities for the years 2012 through 2018. The data are given in the following table. In any of the possible two-stock portfolios, the weight of each stock in the portfolio will be 50%. The three possible portfolio combinations are AB,AC, and BC Create a spreadsheet similar to Tables 8.6 and 8.7R to answer the following: a. Calculate the average return for each individual stock. b. Calculate the standard deviation for each individual stock. c. Calculate the average returns for portfolios AB,AC, and BC. d. Calculate the standard deviations for portfolios AB,AC, and BC. e. Would you recommend that Jane invest in the single stock A or the portfolio consisting of stocks A and B? Explain your answer from a risk-return viewpoint. f. Would you recommend that Jane invest in the single stock B or the portfolio consisting of stocks B and C? Explain your answer from a risk-return viewpoint. Table 8.6 Historicai Retuens, Average Return, and Standard Deviation for Portiolio XY A. Mistorical sartfollin ratume B. Average portfolio return, 2014-2018 F2=512%+12%+12%+12%+12%=12% c. Standard deviation of portfolio retums b p=51(12%12%)2+(12%12%)2+(12%12%)2+(12%12%)2+(12%12%)2=0% rX=58%+10%+12%+14%+16%=12%rY=516%+14%+12%+10%+8%=12% x=51(8%12%)2+(10%12%)2+(12%12)2+(14%128)2+(16%12%)2=3.16%r=51(168125)2+(145124)2+(127124)2+(10%124)2+(851276)2=3.16% Assets X and Y are quite similar in that both have an average return of 12% and a standard deviation of 3.16% during the 2014 to 2018 period. Now let us see what happens when we put the two assets together in a portfolio. The latter columnn of part A show what return a portfolio consisting of assets X and Y would have earned in each year. Notice that a rather atrange outcome occurs for rY=516%+14%+12%+10%+8%=12% x=51(8%12%)2+(10%12%)2+(12%12%)2+(14%12%)2+(16%12%)2=3.16%y=51(16%12%)2+(14%12%)2+(12%12%)2+(10%12%)2+(8%12%)2=3.16% Assets X and Y are quite similar in that both have an average return of 12% and a standard deviation of 3.16% during the 2014 to 2018 period. Now let us see what happens when we put the two assets together in a portfolio. The latter columns of part A show what return a portfolio consisting of assets X and Y would have eamed in each year. Notice that a rather strange outcome occurs for the portfolio. Even though the returns of assets X and Y fluctuate from year to year, the portfolio produces the same 12% return every single year. Parts B and C show the calculations behind the rather obvious conclusion that portfolio XYY average historical return is 12% and its standard deviation is 0%. If you look carefully at the historical returns on assets X and Y, you can see they are moving in opposite directions. In other words, Asset X's retum is lowest in 2014 and highest in 2018, whereas the opposite is true for Asset Y. As a result, movements in the returns of Asset X are always exactly offset by opposite movements in Asset Y 's return, so the 50-50 portfolio earns the same return year after year. This result is a very special case of a crucial concept in portfolio theory called correlation, to which we now turn. Table 8.7 Average Retums and Standard Deviations for Portfolios XY and XZ c Dxing Equation B.3aP. Note that for any portiolio consisting of two assets, you coald also calculate the portiolio otandard deviation directly by uaing the atandard deviations of the ausets in the portolin as well as the correlation coefficient between them uning the following formulaz Where m and w2 are the fractions of the portiolio inverted in assets 1 and 2,1 and 2 are the standard deviations of each asset, and u is the correlation coefficient between asets 1 and 2 so, for portfilio Y the correlation coefficient would be -1.0 , and foe portfolio 2 the correlatian coetficient would be La. Portfolio XY Portfolio XY (shown initially in Table 8.60 and repeated in Table 8.70) is created by combining equal portions of assets X and Y, the perfectly negatively correlated assets. The volatility in this portfolio, as reflected by its standard deviation, equals 0%, whereas the expected return is 12%. Thus, the formation of portfolio XY results in the complete elimination of risk because in each and every year the portfolio earns a 12% return. 5 Whenever assets are perfectly negatively correlated, some combination of the fwo assets exists such that the resulting portfolio's retums are risk free. Portfolio XZ Portfolio XZ (shown in Table 8.79 ) is created by combining equal portions of assets X and Z, the perfectly positively correlated assets. Individually, assets X and Z have the same standard deviation, 3.16%, and because they always move together, combining them in a portfolio does nothing to reduce risk; the portiolio standard Portfolio XY Portfolio XY (shown initially in Table 8.60 and repeated in Table 8.70 ) is created by combining equal portions of assets X and Y, the perfectly negatively correlated assets. The volatility in this portfolio, as reflected by its standard deviation, equals 0%, whereas the expected return is 12%. Thus, the formation of portfolio XY results in the complete elimination of risk because in each and every year the portfolio earns a 12% return. 5 Whenever assets are perfectly negatively correlated, some combination of the two assets exists such that the resulting portfolio's retums are risk free. Portfolio XZ Portfolio XZ (shown in Table 8.7% ) is created by combining equal portions of assets X and Z, the perfectly positively correlated assets. Individually, assets X and Z have the same standard deviation, 3.16%, and because they always move together, combining them in a portfolio does nothing to reduce risk; the portfolio standard deviation is also 3.16%. As was the case with portfolio XY, the expected return of portfolio XZ is 12%. Because both portfolios provide the same expected return, but portfolio XY achieves that expected return with no risk, portfolio XY is clearly preferred by risk-averse investors over portfolio XZ


