

Answered step by step
Verified Expert Solution
Question
1 Approved Answer
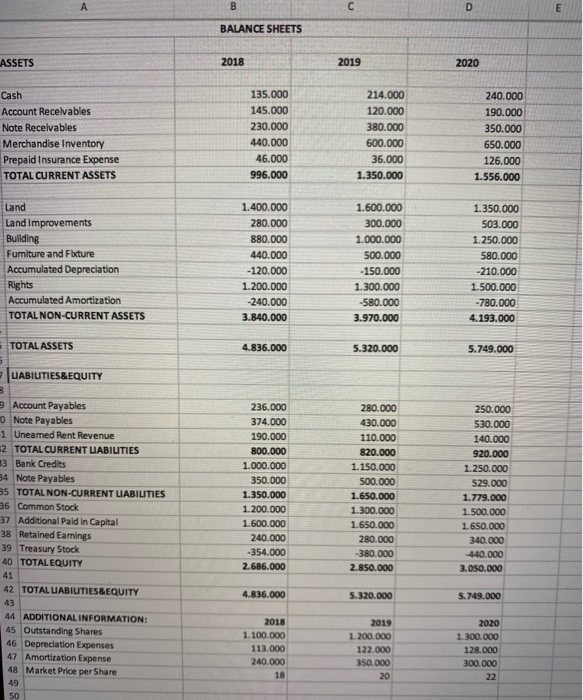
A B D E BALANCE SHEETS ASSETS 2018 2019 2020 Cash Account Receivables Note Receivables Merchandise Inventory Prepaid Insurance Expense TOTAL CURRENT ASSETS 135.000 145.000
Step by Step Solution
There are 3 Steps involved in it
Step: 1

Get Instant Access to Expert-Tailored Solutions
See step-by-step solutions with expert insights and AI powered tools for academic success
Step: 2

Step: 3
Ace Your Homework with AI
Get the answers you need in no time with our AI-driven, step-by-step assistance
Get Started
Finance At Work
Authors: Valérie Boussard
1st Edition
113820403X, 978-1138204034