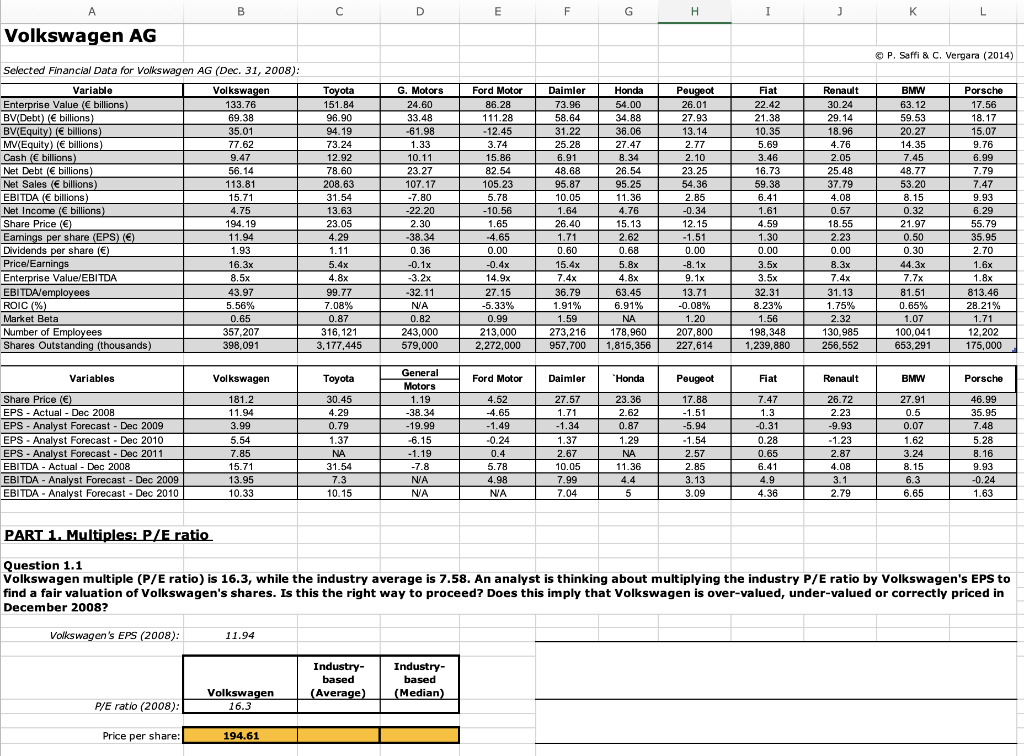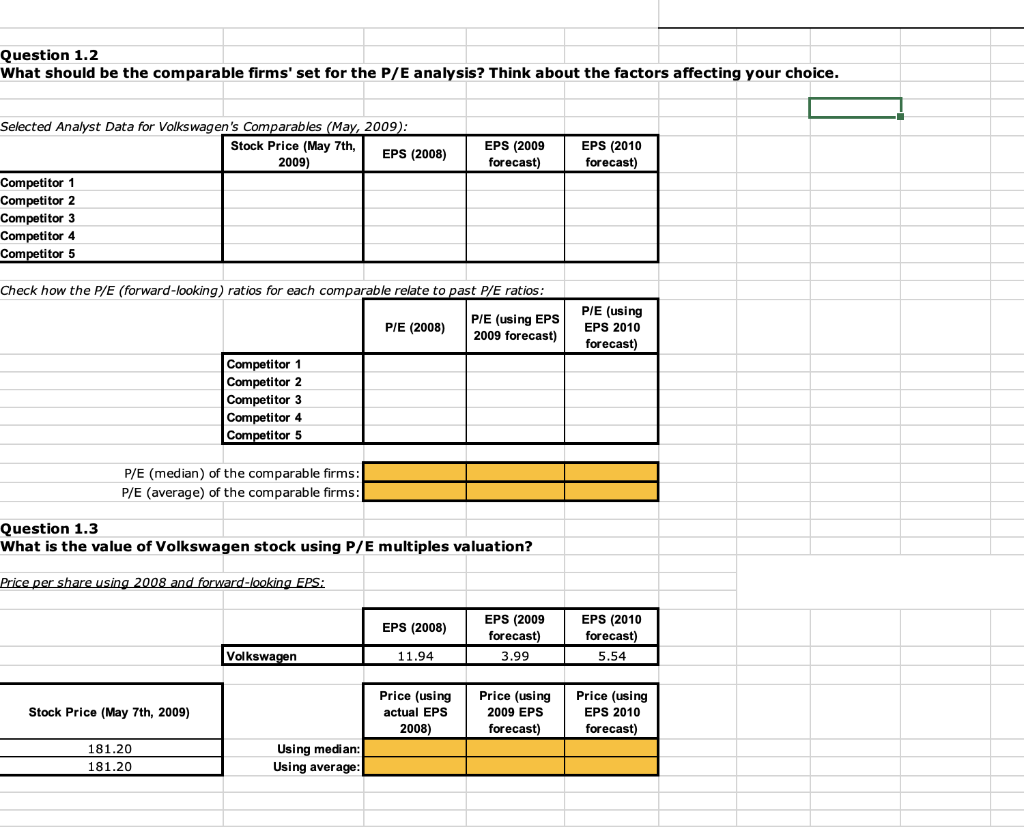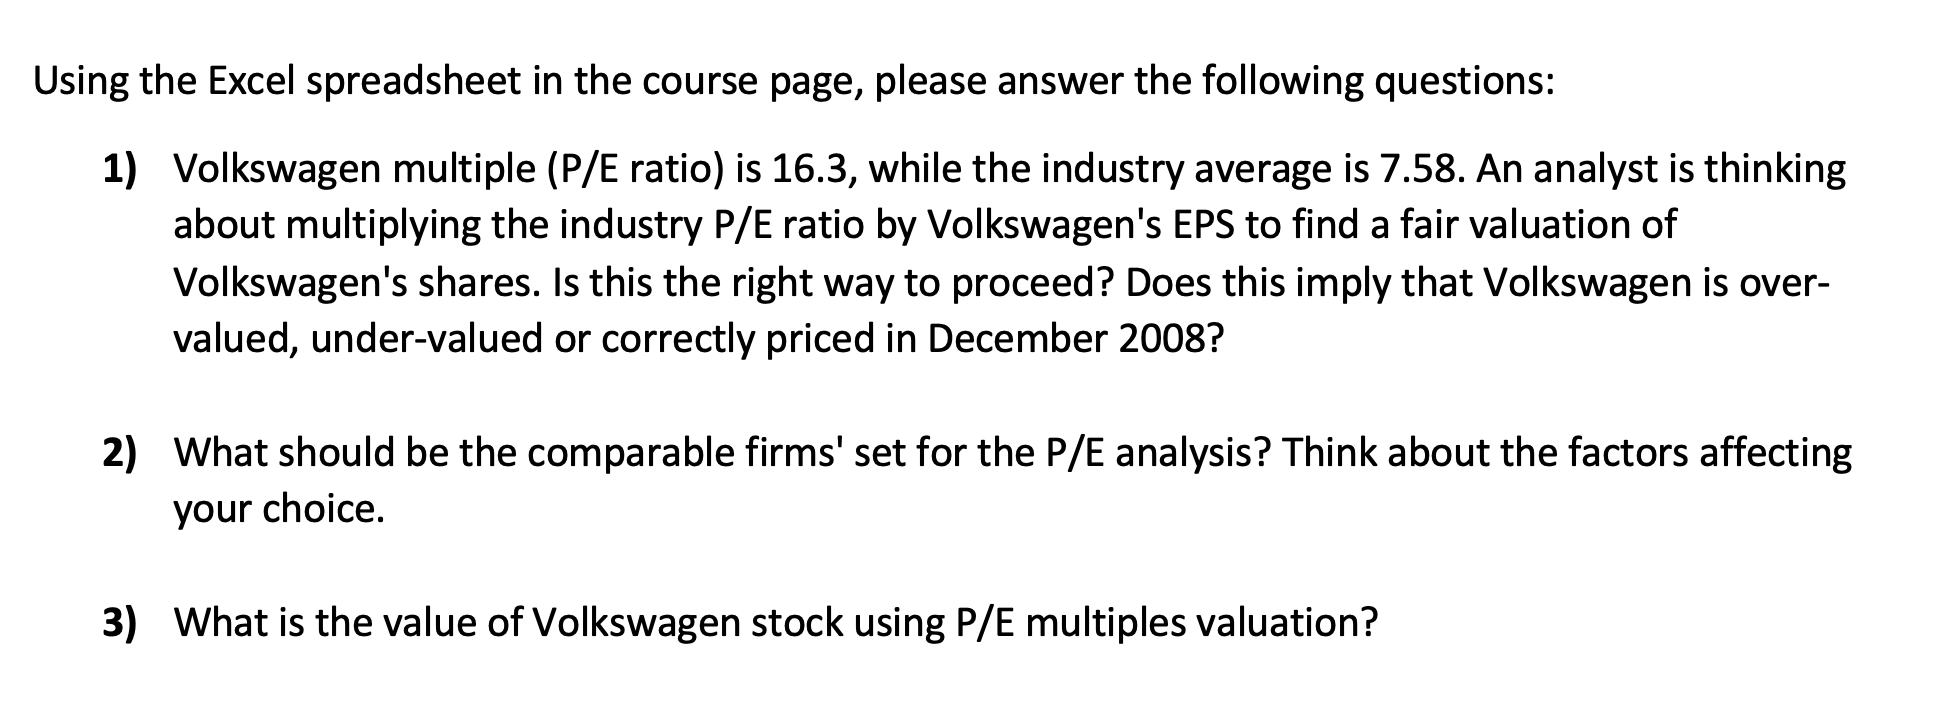


A B D E F G H I J K L Volkswagen AG P. Saffi & C. Vergara (2014) Daimler 73.96 58.64 31.22 25.28 Selected Financial Data for Volkswagen AG (Dec. 31, 2008): Variable Volkswagen Enterprise Value ( billions) 133.76 BV(Debt) ( billions) () ) 69.38 BV(Equity) ( billions) 35.01 MV(Equity) ( billions 77.62 Cash (6 billions) 9.47 Net Debt ( billions) 56.14 Net Sales ( billions) 113.81 EBITDA ( billions) 15.71 Net Income ( billions) 4.75 Share Price (6) 194.19 Earings per share (EPS) () 11.94 Dividends per share () 1.93 Price/Earnings 16.3x Enterprise Value/EBITDA 8.5x EBITDA employees 43.97 ROIC (%) 5.56% Market Beta 0.65 Number of Employees 357,207 Shares Outstanding (thousands) 398,091 Toyota 151.84 96.90 94.19 73.24 12.92 78.60 208.63 31.54 13.63 23.05 4.29 1.11 5.4x 4.8x 99.77 7.08% 0.87 316,121 3,177,445 G. Motors 24.60 33.48 -61.98 1.33 10.11 23.27 107.17 -7.80 -22.20 2.30 -38.34 0.36 -0.1x -3.2x -32.11 NA 0.82 243,000 579,000 Ford Motor 86.28 111.28 - 12.45 3.74 15.86 82.54 105.23 5.78 -10.56 1.65 -4.65 0.00 -0.4x 14.9x 27.15 -5.33% 0.99 213,000 2,272,000 6.91 48.68 95.87 10.05 1.64 26.40 1.71 0.60 15.4x 7.4x 36.79 1.91% 1.59 273,216 957,700 Honda 54.00 34.88 36.06 27.47 8.34 26.54 95.25 11.36 4.76 15.13 2.62 0.68 5.8x 4.8x 63.45 6.91% NA 178,960 1,815,356 Peugeot 26.01 27.93 13.14 2.77 2.10 23.25 54.36 2.85 -0.34 12.15 -1.51 0.00 -8. 1x 9.1x 13.71 -0.08% 1.20 207,800 227,614 Fiat 22.42 21.38 10.35 5.69 3.46 16.73 59.38 6.41 1.61 4.59 1.30 0.00 3.5x 3.5x 32.31 8.23% 1.56 198,348 1,239,880 Renault 30.24 29.14 18.96 4.76 2.05 25.48 37.79 4.08 0.57 18.55 2.23 0.00 8.3x 7.4x 31.13 1.75% 2.32 130,985 256,552 BMW 63.12 59.53 20.27 14.35 7.45 48.77 53. 20 8.15 0.32 21.97 0.50 0.30 44.3x 7.7x 81.51 0.65% 1.07 100,041 653,291 Porsche 17.56 18.17 15.07 9.76 6.99 7.79 7.47 9.93 6.29 55.79 35.95 2.70 1.6x 1.8x 813.46 28.21% 1.71 12,202 175,000 Variables Volkswagen Toyota Ford Motor Daimler " "Honda Peugeot Fiat Renault BMW Porsche Share Price () EPS - Actual - Dec 2008 EPS - Analyst Forecast - Dec 2009 EPS - Analyst Forecast - Dec 2010 EPS - Analyst Forecast - Dec 2011 EBITDA - Actual - Dec 2008 EBITDA - Analyst Forecast - Dec 2009 EBITDA - Analyst Forecast - Dec 2010 181.2 11.94 3.99 5.54 7.85 15.71 13.95 10.33 30.45 4.29 0.79 1.37 NA 31.54 7.3 10.15 General Motors 1.19 -38.34 -19.99 -6.15 -1.19 -7.8 NA NA 4.52 -4.65 -1.49 -0.24 0.4 5.78 4.98 NA 27.57 1.71 -1.34 1.37 2.67 10.05 7.99 7.04 23.36 2.62 0.87 1.29 NA 11.36 4.4 5 17.88 -1.51 -5.94 -1.54 2.57 2.85 3.13 3.09 7.47 1.3 -0.31 0.28 0.65 6.41 4.9 4.36 26.72 2.23 -9.93 -1.23 2.87 4.08 3.1 2.79 27.91 0.5 0.07 1.62 3.24 8.15 6.3 6.65 46.99 35.95 7.48 5.28 8.16 9.93 -0.24 1.63 PART 1. Multiples: P/E ratio Question 1.1 Volkswagen multiple (P/E ratio) is 16.3, while the industry average is 7.58. An analyst is thinking about multiplying the industry P/E ratio by Volkswagen's EPS to find a fair valuation of Volkswagen's shares. Is this the right way to proceed? Does this imply that Volkswagen is over-valued, under-valued or correctly priced in December 2008? Volkswagen's EPS (2008): 11.94 Industry- based (Average) Industry- based (Median) Volkswagen 16.3 P/E ratio (2008): Price per share: 194.61 Question 1.2 What should be the comparable firms' set for the P/E analysis? Think about the factors affecting your choice. EPS (2009 EPS (2010 forecast) forecast) Selected Analyst Data for Volkswagen's Comparables (May, 2009): Stock Price (May 7th, EPS (2008) 2009) Competitor 1 Competitor 2 Competitor 3 Competitor 4 Competitor 5 Check how the P/E (forward-looking) ratios for each comparable relate to past P/E ratios: P/E (2008) P/E (using EPS 2009 forecast) P/E (using EPS 2010 forecast) Competitor 1 Competitor 2 Competitor 3 Competitor 4 Competitor 5 P/E (median) of the comparable firms: P/E (average) of the comparable firms: Question 1.3 What is the value of Volkswagen stock using P/E multiples valuation? Price per share using 2008 and forward-looking EPS: EPS (2008) EPS (2009 forecast) 3.99 EPS (2010 forecast) 5.54 Volkswagen 11.94 Price (using Stock Price (May 7th, 2009) Price (using actual EPS 2008) 2009 EPS forecast) Price (using EPS 2010 forecast) 181.20 181.20 Using median: Using average: Using the Excel spreadsheet in the course page, please answer the following questions: 1) Volkswagen multiple (P/E ratio) is 16.3, while the industry average is 7.58. An analyst is thinking about multiplying the industry P/E ratio by Volkswagen's EPS to find a fair valuation of Volkswagen's shares. Is this the right way to proceed? Does this imply that Volkswagen is over- valued, under-valued or correctly priced in December 2008? 2) What should be the comparable firms' set for the P/E analysis? Think about the factors affecting your choice. 3) What is the value of Volkswagen stock using P/E multiples valuation


