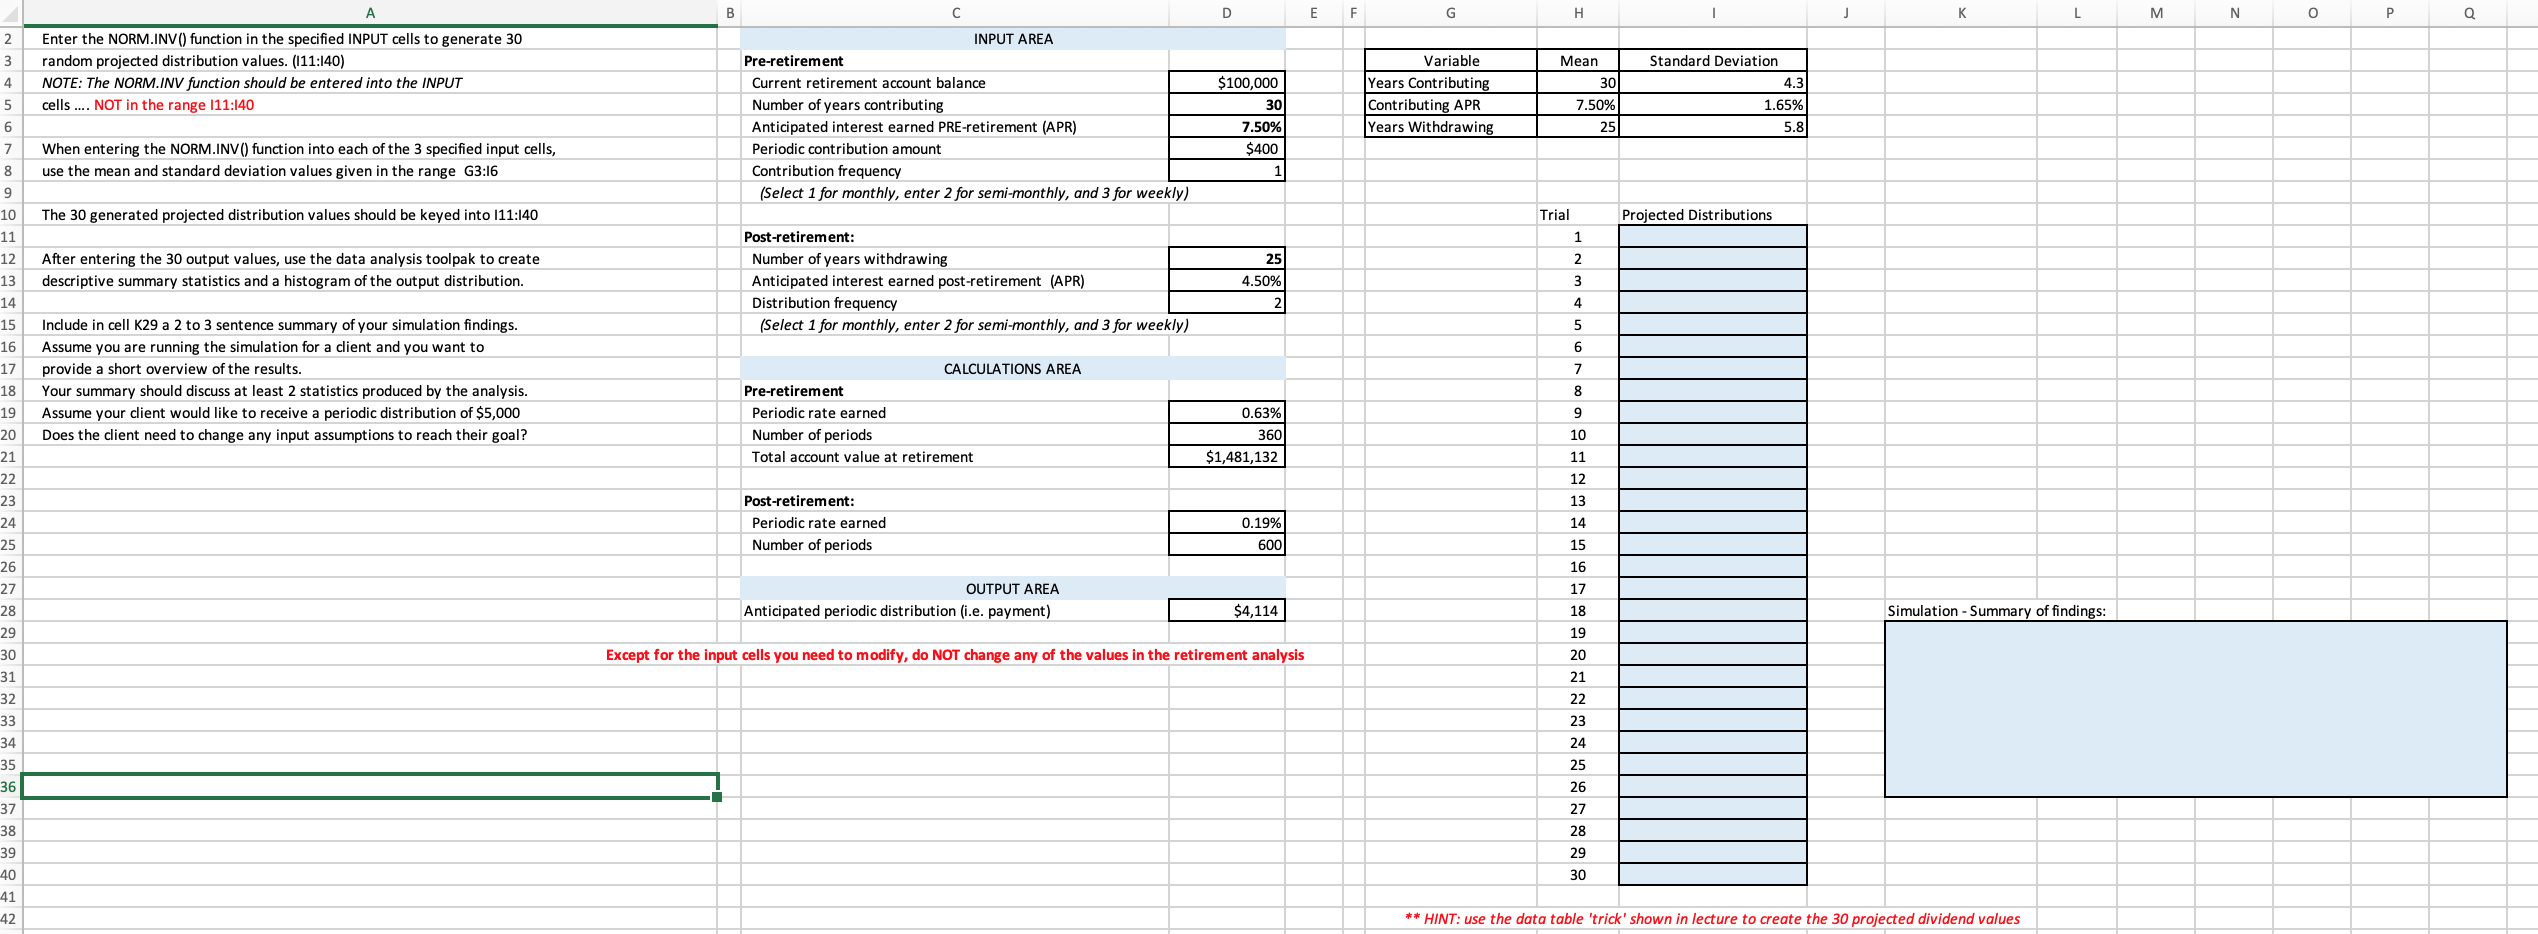
A B D E F G H J L M N o Q Mean 2 3 4 5 6 Enter the NORM.INV() function in the specified INPUT cells to generate 30 random projected distribution values. (111:140) NOTE: The NORM.INV function should be entered into the INPUT cells .... NOT in the range 111:140 $100,000 30 INPUT AREA Pre-retirement Current retirement account balance Number of years contributing Anticipated interest earned PRE-retirement (APR) Periodic contribution amount Contribution frequency (Select 1 for monthly, enter 2 for semi-monthly, and 3 for weekly) Variable Years Contributing Contributing APR Years Withdrawing 30 7.50% Standard Deviation 4.3 1.65% 5.8 25 7.50% $400 7 When entering the NORM.INV() function into each of the 3 specified input cells, use the mean and standard deviation values given in the range G3:16 1 8 9 10 The 30 generated projected distribution values should be keyed into 111:140 Trial Projected Distributions 1 After entering the 30 output values, use the data analysis toolpak to create descriptive summary statistics and a histogram of the output distribution. Post-retirement: Number of years withdrawing Anticipated interest earned post-retirement (APR) Distribution frequency (Select 1 for monthly, enter 2 for semi-monthly, and 3 for weekly) 25 4.50% 2 2 3 4 5 6 7 Include in cell K29 a 2 to 3 sentence summary of your simulation findings. Assume you are running the simulation for a client and you want to provide a short overview of the results. Your summary should discuss at least 2 statistics produced by the analysis. Assume your client would like to receive a periodic distribution of $5,000 Does the client need to change any input assumptions to reach their goal? 8 CALCULATIONS AREA Pre-retirement Periodic rate earned Number of periods Total account value at retirement 9 5 0.63% 360) $1,481,132 10 11 Post-retirement: Periodic rate earned Number of periods 12 13 14 0.19% 600 15 16 11 12 13 14 15 16 17 18 19 20 21 22 23 24 25 26 27 28 29 30 31 32 33 34 35 36 37 38 39 40 41 42 17 OUTPUT AREA Anticipated periodic distribution (i.e. payment) $4,114 18 Simulation - Summary of findings: 19 Except for the input cells you need to modify, do NOT change any of the values in the retirement analysis 20 21 22 23 24 25 26 27 28 29 30 ** HINT: use the data table 'trick' shown in lecture to create the 30 projected dividend values A B D E F G H J L M N o Q Mean 2 3 4 5 6 Enter the NORM.INV() function in the specified INPUT cells to generate 30 random projected distribution values. (111:140) NOTE: The NORM.INV function should be entered into the INPUT cells .... NOT in the range 111:140 $100,000 30 INPUT AREA Pre-retirement Current retirement account balance Number of years contributing Anticipated interest earned PRE-retirement (APR) Periodic contribution amount Contribution frequency (Select 1 for monthly, enter 2 for semi-monthly, and 3 for weekly) Variable Years Contributing Contributing APR Years Withdrawing 30 7.50% Standard Deviation 4.3 1.65% 5.8 25 7.50% $400 7 When entering the NORM.INV() function into each of the 3 specified input cells, use the mean and standard deviation values given in the range G3:16 1 8 9 10 The 30 generated projected distribution values should be keyed into 111:140 Trial Projected Distributions 1 After entering the 30 output values, use the data analysis toolpak to create descriptive summary statistics and a histogram of the output distribution. Post-retirement: Number of years withdrawing Anticipated interest earned post-retirement (APR) Distribution frequency (Select 1 for monthly, enter 2 for semi-monthly, and 3 for weekly) 25 4.50% 2 2 3 4 5 6 7 Include in cell K29 a 2 to 3 sentence summary of your simulation findings. Assume you are running the simulation for a client and you want to provide a short overview of the results. Your summary should discuss at least 2 statistics produced by the analysis. Assume your client would like to receive a periodic distribution of $5,000 Does the client need to change any input assumptions to reach their goal? 8 CALCULATIONS AREA Pre-retirement Periodic rate earned Number of periods Total account value at retirement 9 5 0.63% 360) $1,481,132 10 11 Post-retirement: Periodic rate earned Number of periods 12 13 14 0.19% 600 15 16 11 12 13 14 15 16 17 18 19 20 21 22 23 24 25 26 27 28 29 30 31 32 33 34 35 36 37 38 39 40 41 42 17 OUTPUT AREA Anticipated periodic distribution (i.e. payment) $4,114 18 Simulation - Summary of findings: 19 Except for the input cells you need to modify, do NOT change any of the values in the retirement analysis 20 21 22 23 24 25 26 27 28 29 30 ** HINT: use the data table 'trick' shown in lecture to create the 30 projected dividend values


