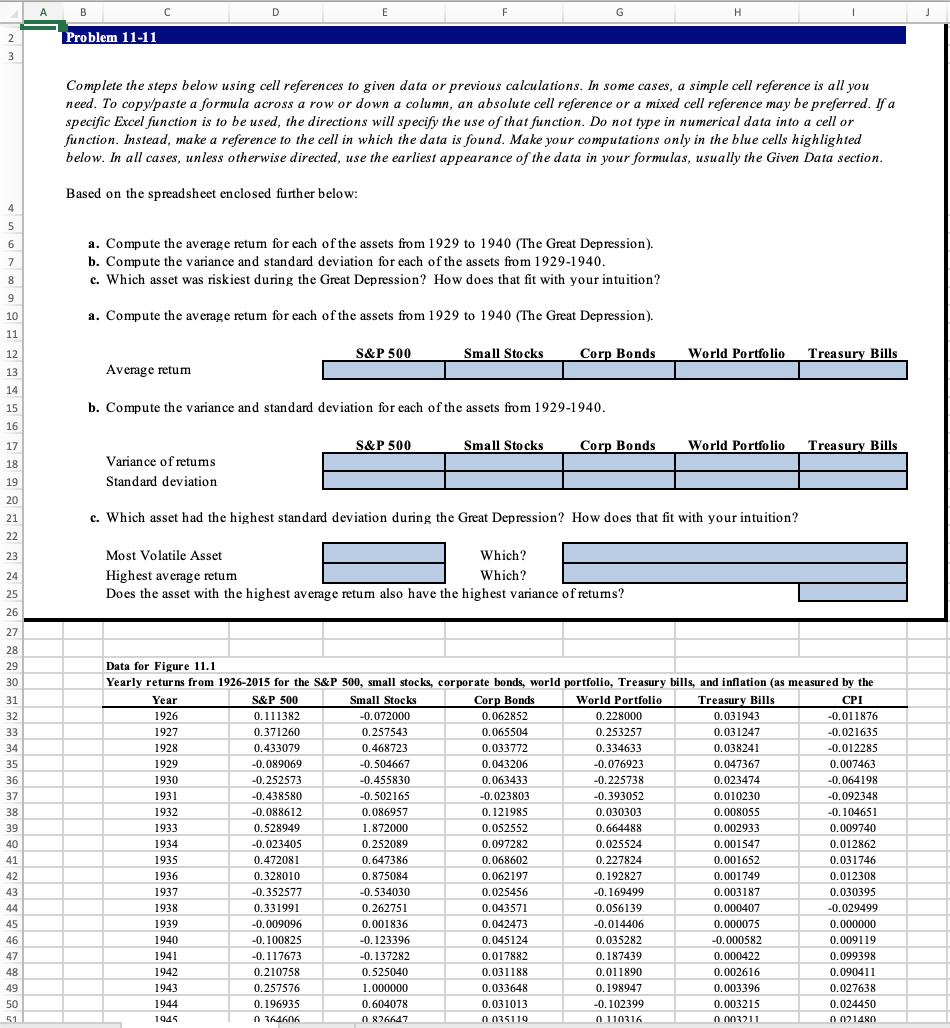
A B D E F H 2 Problem 11-11 3 Complete the steps below using cell references to given data or previous calculations. In some cases, a simple cell reference is all you need. To copy/paste a formula across a row or down a column, an absolute cell reference or a mixed cell reference may be preferred. If a specific Excel function is to be used, the directions will specify the use of that function. Do not type in numerical data into a cell or function. Instead, make a reference to the cell in which the data is found. Make your computations only in the blue cells highlighted below. In all cases, unless otherwise directed, use the earliest appearance of the data in your formulas, usually the Given Data section. Based on the spreadsheet enclosed further below: 4 5 6 7 8 a. Compute the average retum for each of the assets from 1929 to 1940 (The Great Depression). b. Compute the variance and standard deviation for each of the assets from 1929-1940. c. Which asset was riskiest during the Great Depression? How does that fit with your intuition? 9 10 a. Compute the average retum for each of the assets from 1929 to 1940 (The Great Depression). 11 12 S&P 500 Small Stocks Corp Bonds World Portfolio Treasury Bills 13 Average retum 14 15 b. Compute the variance and standard deviation for each of the assets from 1929-1940. 16 17 S&P 500 Small Stocks Corp Bonds World Portfolio Treasury Bills 18 Variance of retums Standard deviation 19 20 21 22 c. Which asset had the highest standard deviation during the Great Depression? How does that fit with your intuition? 23 24 25 26 Most Volatile Asset Which? Highest average retum Which? Does the asset with the highest average retum also have the highest variance of retums? 27 28 29 30 31 32 33 33 34 35 30 36 37 so 38 3 39 40 41 4 42 43 V.DE Data for Figure 11.1 Yearly returns from 1926-2015 for the S&P 500, small stocks, corporate bonds, world portfolio, Treasury bills, and inflation (as measured by the Year S&P 500 Small Stocks Corp Bonds World Portfolio Treasury Bills CPI 1926 0.111382 -0.072000 0.062852 0.228000 0.031943 -0.011876 1927 0.371260 0.257543 0.065504 0.253257 0.031247 -0.021635 1928 0.433079 0.468723 0.033772 0.334633 0.038241 -0.012285 122 1929 -0.007002 -0.089069 -0.504667 0.043206 173200 -0.076923 0.047367 0.007463 0.007463 1930 2014 -0.252573 -0.2222 -0.455830 0.063433 -0.225738 0.003932 V.223 0.023474 -0.064198 0.00190 1931 -0.438580 -0.502165 -0.023803 W10JOU -0.393052 0.010230 wa Uwe 0.0102SU -0.092348 1932 -0.088612 0.072370 0.121985 -0.000012 0.086957 0.121983 0.030303 0.008055 -0.104651 W.CVOUS 1933 0.528949 1.872000 0.052552 0.664488 0.002933 0.00233 0.009740 1934 1737 W.217 -0.023405 -0.0230 0.252089 0.025524 0.097282 0.02322 0.001547 0.012862 1935 1.1/2001 0.647386 0.227824 0.227824 0.001652 0.031746 0.031/46 1936 0.328010 0.875084 1 0.062197 0.192827 0.001749 0.012308 1937 -0.352577 -0.534030 0.025456 14 -0.169499 0.003187 0.030395 1938 0.331991 0.262751 11 0.043571 1 0.056139 0.000407 -0.029499 1939 -0.009096 0.001836 0.042473 -0.014406 0.000075 0.000000 10000 1940 -0.100825 -0.123396 0.045124 0.035282 -0.000582 0.009119 1941 1994 -0.117673 -0.137282 0.017882 0.187439 0.000422 0.099398 1942 0.210758 0.525040 0.031188 0.011890 0.002616 0.090411 1943 0.257576 1.000000 0.033648 0.198947 0.003396 0.027638 1944 0.196935 0.604078 0.031013 -0.102399 0.003215 0.024450 1945 0 364606 0826647 0035119 0110316 0.003211 0021480 0.068602 44 45 46 47 48 49 50 51 A B D E F H 2 Problem 11-11 3 Complete the steps below using cell references to given data or previous calculations. In some cases, a simple cell reference is all you need. To copy/paste a formula across a row or down a column, an absolute cell reference or a mixed cell reference may be preferred. If a specific Excel function is to be used, the directions will specify the use of that function. Do not type in numerical data into a cell or function. Instead, make a reference to the cell in which the data is found. Make your computations only in the blue cells highlighted below. In all cases, unless otherwise directed, use the earliest appearance of the data in your formulas, usually the Given Data section. Based on the spreadsheet enclosed further below: 4 5 6 7 8 a. Compute the average retum for each of the assets from 1929 to 1940 (The Great Depression). b. Compute the variance and standard deviation for each of the assets from 1929-1940. c. Which asset was riskiest during the Great Depression? How does that fit with your intuition? 9 10 a. Compute the average retum for each of the assets from 1929 to 1940 (The Great Depression). 11 12 S&P 500 Small Stocks Corp Bonds World Portfolio Treasury Bills 13 Average retum 14 15 b. Compute the variance and standard deviation for each of the assets from 1929-1940. 16 17 S&P 500 Small Stocks Corp Bonds World Portfolio Treasury Bills 18 Variance of retums Standard deviation 19 20 21 22 c. Which asset had the highest standard deviation during the Great Depression? How does that fit with your intuition? 23 24 25 26 Most Volatile Asset Which? Highest average retum Which? Does the asset with the highest average retum also have the highest variance of retums? 27 28 29 30 31 32 33 33 34 35 30 36 37 so 38 3 39 40 41 4 42 43 V.DE Data for Figure 11.1 Yearly returns from 1926-2015 for the S&P 500, small stocks, corporate bonds, world portfolio, Treasury bills, and inflation (as measured by the Year S&P 500 Small Stocks Corp Bonds World Portfolio Treasury Bills CPI 1926 0.111382 -0.072000 0.062852 0.228000 0.031943 -0.011876 1927 0.371260 0.257543 0.065504 0.253257 0.031247 -0.021635 1928 0.433079 0.468723 0.033772 0.334633 0.038241 -0.012285 122 1929 -0.007002 -0.089069 -0.504667 0.043206 173200 -0.076923 0.047367 0.007463 0.007463 1930 2014 -0.252573 -0.2222 -0.455830 0.063433 -0.225738 0.003932 V.223 0.023474 -0.064198 0.00190 1931 -0.438580 -0.502165 -0.023803 W10JOU -0.393052 0.010230 wa Uwe 0.0102SU -0.092348 1932 -0.088612 0.072370 0.121985 -0.000012 0.086957 0.121983 0.030303 0.008055 -0.104651 W.CVOUS 1933 0.528949 1.872000 0.052552 0.664488 0.002933 0.00233 0.009740 1934 1737 W.217 -0.023405 -0.0230 0.252089 0.025524 0.097282 0.02322 0.001547 0.012862 1935 1.1/2001 0.647386 0.227824 0.227824 0.001652 0.031746 0.031/46 1936 0.328010 0.875084 1 0.062197 0.192827 0.001749 0.012308 1937 -0.352577 -0.534030 0.025456 14 -0.169499 0.003187 0.030395 1938 0.331991 0.262751 11 0.043571 1 0.056139 0.000407 -0.029499 1939 -0.009096 0.001836 0.042473 -0.014406 0.000075 0.000000 10000 1940 -0.100825 -0.123396 0.045124 0.035282 -0.000582 0.009119 1941 1994 -0.117673 -0.137282 0.017882 0.187439 0.000422 0.099398 1942 0.210758 0.525040 0.031188 0.011890 0.002616 0.090411 1943 0.257576 1.000000 0.033648 0.198947 0.003396 0.027638 1944 0.196935 0.604078 0.031013 -0.102399 0.003215 0.024450 1945 0 364606 0826647 0035119 0110316 0.003211 0021480 0.068602 44 45 46 47 48 49 50 51


