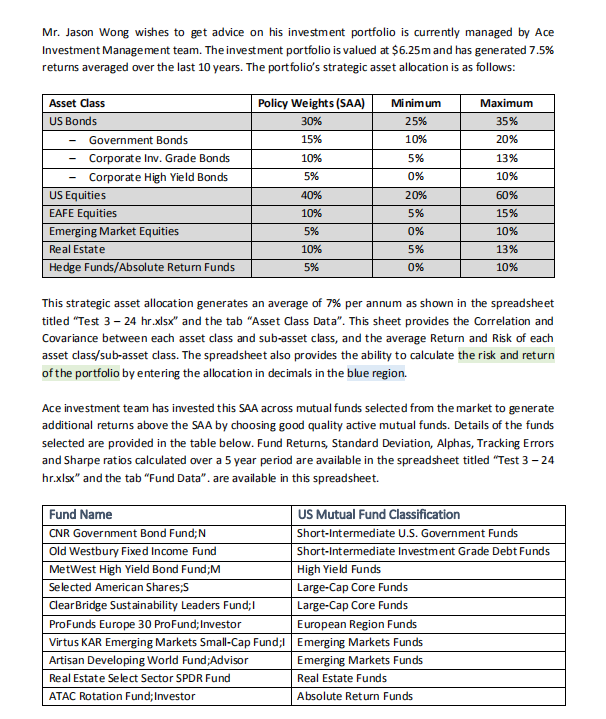
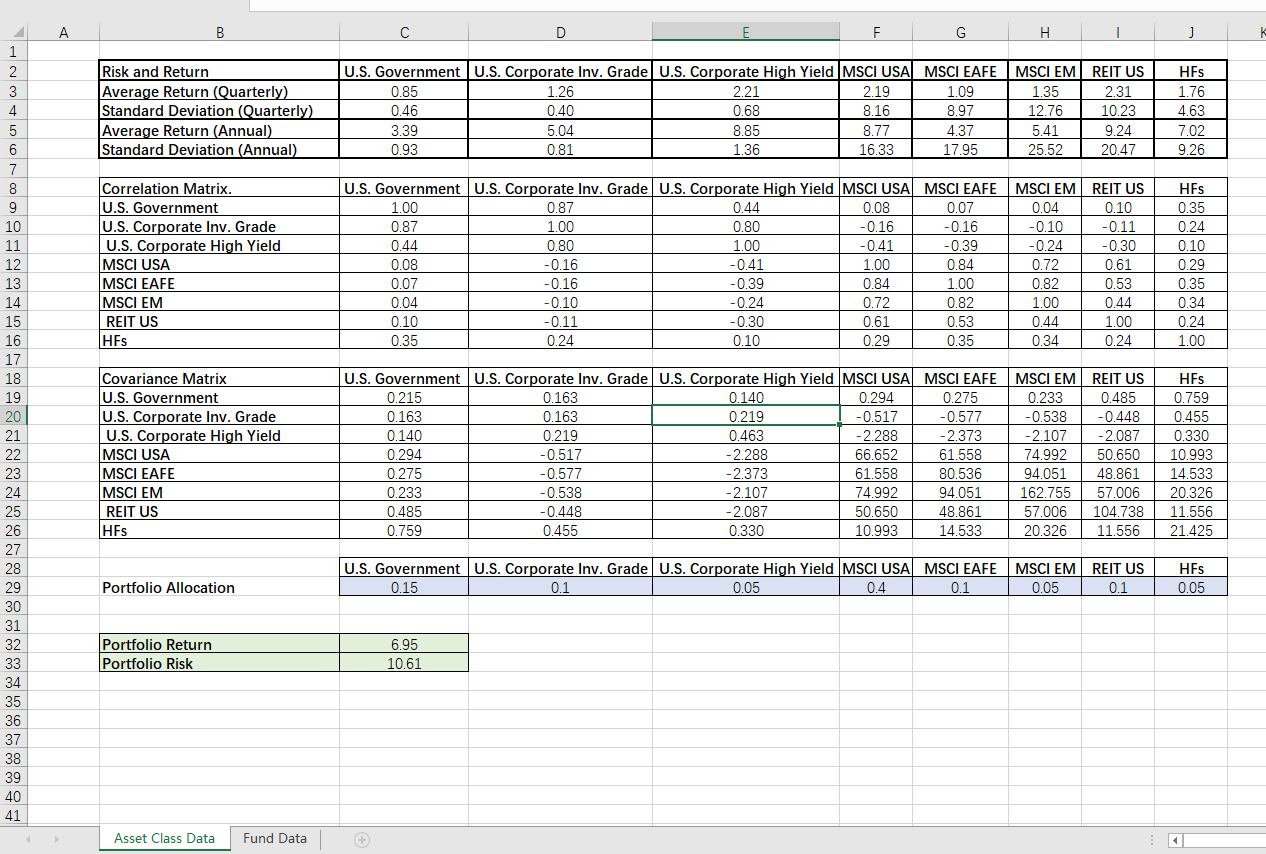
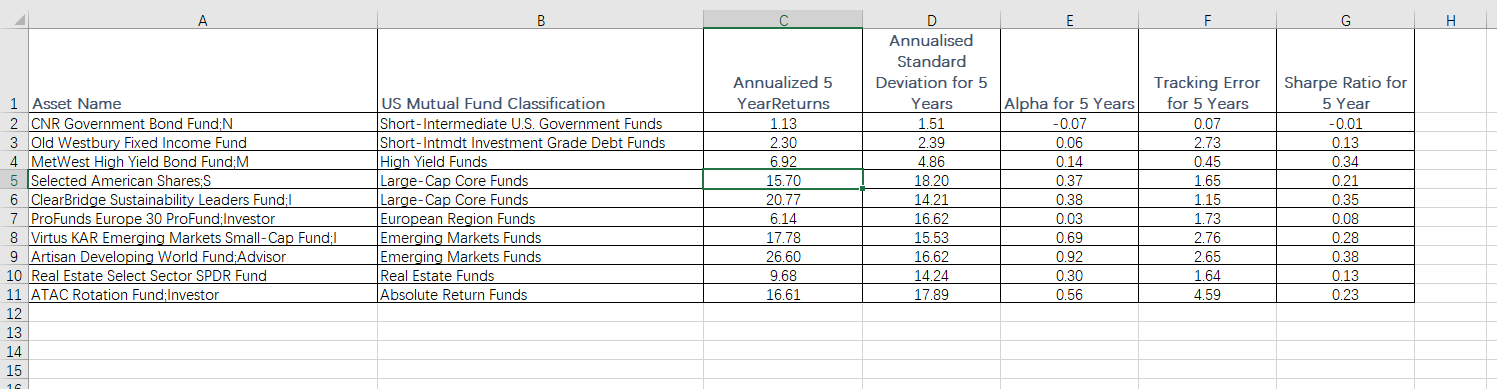
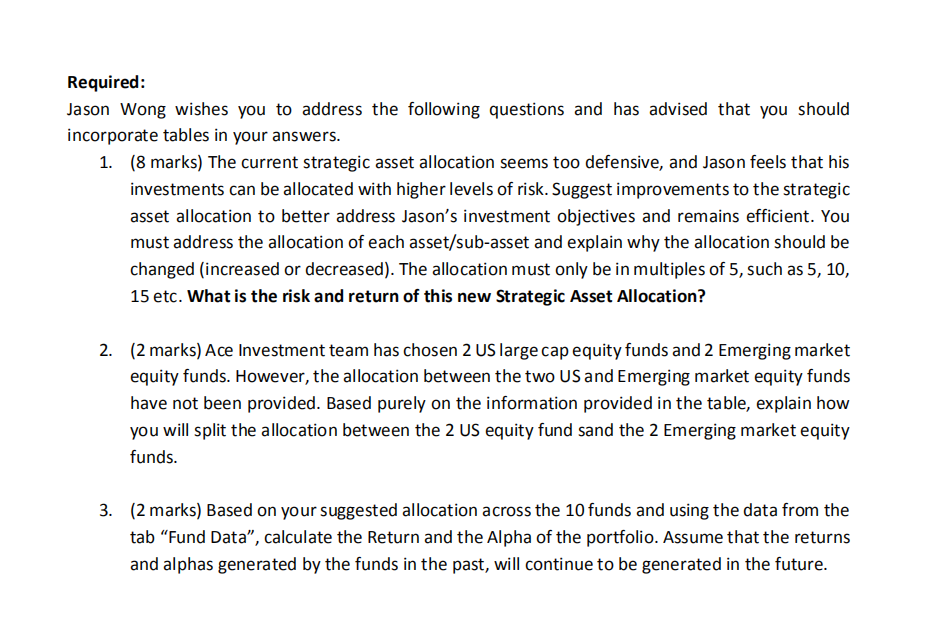
A B D G . 1 ] K Risk and Return Average Return (Quarterly) Standard Deviation Quarterly) Average Return (Annual) Standard Deviation (Annual) U.S. Government U.S. Corporate Inv. Grade U.S. Corporate High Yield MSCI USA MSCI EAFE 0.85 1.26 2.21 2.19 1.09 0.46 0.40 0.68 8.16 8.97 3.39 5.04 8.85 8.77 4.37 0.93 0.81 1.36 16.33 17.95 MSCI EM REIT US 1.35 2.31 12.76 10.23 5.41 9.24 25.52 20.47 HES 1.76 4.63 7.02 9.26 Correlation Matrix. U.S. Government U.S. Corporate Inv. Grade U.S. Corporate High Yield MSCI USA MSCI EAFE MSCI EM REIT US HFS U.S. Government U.S. Corporate Inv. Grade U.S. Corporate High Yield MSCI USA MSCI EAFE 1.00 0.87 0.44 0.08 0.07 0.87 1.00 0.80 -0.16 -0.16 0.44 0.80 1.00 -0.41 -0.39 -0.16 -0.41 1.00 0.84 0.07 -0.16 -0.39 0.84 1.00 0.04 -0.10 -0.24 0.72 0.82 0.10 -0.11 -0.30 0.61 0.53 0.35 0.24 0.10 0.29 0.35 0.08 MSCI EM REIT US 0.04 0.10 -0.10 -0.11 -0.24 -0.30 0.72 0.61 0.82 0.53 1.00 0.44 0.44 1.00 0.34 0.24 HES 0.35 0.24 0.10 0.29 0.35 0.34 0.24 1.00 1 2 3 4 5 6 7 8 9 10 11 12 13 14 15 16 17 18 19 20 21 22 23 24 25 26 27 28 29 30 31 32 33 34 35 36 37 38 39 40 41 Covariance Matrix U.S. Government U.S. Corporate Inv. Grade U.S. Corporate High Yield MSCI USA MSCI EAFE MSCI EM REIT US HFS U.S. Government U.S. Corporate Inv. Grade U.S. Corporate High Yield MSCI USA MSCI EAFE 0.215 0.163 0.140 0.294 0.275 0.163 0.163 0.219 -0.517 -0.577 0.140 0.219 0.463 -2.288 -2.373 0.294 -0.517 -2.288 66.652 61.558 0.275 -0.577 -2.373 61.558 80.536 0.233 -0.538 -2.107 74.992 94.051 0.485 -0.448 -2.087 50.650 48.861 0.759 0.455 0.330 10.993 14.533 MSCI EM REIT US 0.233 0.485 -0.538 -0.448 -2.107 -2.087 74.992 50.650 94.051 48.861 162.755 57.006 57.006 104.738 20.326 11.556 HES 0.759 0.455 0.330 10.993 14.533 20.326 11.556 21.425 U.S. Government U.S. Corporate Inv. Grade U.S. Corporate High Yield MSCI USA MSCI EAFE 0.15 0.1 0.05 0.4 0.1 MSCI EM REIT US 0.05 0.1 HES 0.05 Portfolio Allocation Portfolio Return Portfolio Risk 6.95 10.61 Asset Class Data Fund Data . B E F H Alpha for 5 Years -0.07 0.06 1 Asset Name 2 CNR Government Bond Fund:N 3 Old Westbury Fixed Income Fund 4. MetWest High Yield Bond Fund;M 5 Selected American Shares:S 6 ClearBridge Sustainability Leaders Fund; 7 ProFunds Europe 30 ProFund Investor 8 Virtus KAR Emerging Markets Small-Cap Fund; 9 Artisan Developing World Fund;Advisor 10 Real Estate Select Sector SPDR Fund 11 ATAC Rotation Fund;Investor 12 13 14 15 0.14 US Mutual Fund Classification Short-Intermediate U.S. Government Funds Short-Intmdt Investment Grade Debt Funds High Yield Funds Large-Cap Core Funds Large-Cap Core Funds European Region Funds Emerging Markets Funds Emerging Markets Funds Real Estate Funds Absolute Return Funds D Annualised Standard Deviation for 5 Years 1.51 2.39 4.86 18.20 14.21 16.62 15.53 16.62 14.24 17.89 Annualized 5 Year Returns 1.13 2.30 6.92 15.70 20.77 6.14 17.78 26.60 9.68 16.61 0.37 0.38 0.03 0.69 0.92 0.30 0.56 Tracking Error for 5 Years 0.07 2.73 0.45 1.65 1.15 1.73 2.76 2.65 1.64 4.59 Sharpe Ratio for 5 Year -0.01 0.13 0.34 0.21 0.35 0.08 0.28 0.38 0.13 0.23 Required: Jason Wong wishes you to address the following questions and has advised that you should incorporate tables in your answers. 1. (8 marks) The current strategic asset allocation seems too defensive, and Jason feels that his investments can be allocated with higher levels of risk. Suggest improvements to the strategic asset allocation to better address Jason's investment objectives and remains efficient. You must address the allocation of each asset/sub-asset and explain why the allocation should be changed (increased or decreased). The allocation must only be in multiples of 5, such as 5, 10, 15 etc. What is the risk and return of this new Strategic Asset Allocation? 2. (2 marks) Ace Investment team has chosen 2 US large cap equity funds and 2 Emerging market equity funds. However, the allocation between the two US and Emerging market equity funds have not been provided. Based purely on the information provided in the table, explain how you will split the allocation between the 2 US equity fund sand the 2 Emerging market equity funds. 3. (2 marks) Based on your suggested allocation across the 10 funds and using the data from the tab Fund Data, calculate the Return and the Alpha of the portfolio. Assume that the returns and alphas generated by the funds in the past, will continue to be generated in the future. A B D G . 1 ] K Risk and Return Average Return (Quarterly) Standard Deviation Quarterly) Average Return (Annual) Standard Deviation (Annual) U.S. Government U.S. Corporate Inv. Grade U.S. Corporate High Yield MSCI USA MSCI EAFE 0.85 1.26 2.21 2.19 1.09 0.46 0.40 0.68 8.16 8.97 3.39 5.04 8.85 8.77 4.37 0.93 0.81 1.36 16.33 17.95 MSCI EM REIT US 1.35 2.31 12.76 10.23 5.41 9.24 25.52 20.47 HES 1.76 4.63 7.02 9.26 Correlation Matrix. U.S. Government U.S. Corporate Inv. Grade U.S. Corporate High Yield MSCI USA MSCI EAFE MSCI EM REIT US HFS U.S. Government U.S. Corporate Inv. Grade U.S. Corporate High Yield MSCI USA MSCI EAFE 1.00 0.87 0.44 0.08 0.07 0.87 1.00 0.80 -0.16 -0.16 0.44 0.80 1.00 -0.41 -0.39 -0.16 -0.41 1.00 0.84 0.07 -0.16 -0.39 0.84 1.00 0.04 -0.10 -0.24 0.72 0.82 0.10 -0.11 -0.30 0.61 0.53 0.35 0.24 0.10 0.29 0.35 0.08 MSCI EM REIT US 0.04 0.10 -0.10 -0.11 -0.24 -0.30 0.72 0.61 0.82 0.53 1.00 0.44 0.44 1.00 0.34 0.24 HES 0.35 0.24 0.10 0.29 0.35 0.34 0.24 1.00 1 2 3 4 5 6 7 8 9 10 11 12 13 14 15 16 17 18 19 20 21 22 23 24 25 26 27 28 29 30 31 32 33 34 35 36 37 38 39 40 41 Covariance Matrix U.S. Government U.S. Corporate Inv. Grade U.S. Corporate High Yield MSCI USA MSCI EAFE MSCI EM REIT US HFS U.S. Government U.S. Corporate Inv. Grade U.S. Corporate High Yield MSCI USA MSCI EAFE 0.215 0.163 0.140 0.294 0.275 0.163 0.163 0.219 -0.517 -0.577 0.140 0.219 0.463 -2.288 -2.373 0.294 -0.517 -2.288 66.652 61.558 0.275 -0.577 -2.373 61.558 80.536 0.233 -0.538 -2.107 74.992 94.051 0.485 -0.448 -2.087 50.650 48.861 0.759 0.455 0.330 10.993 14.533 MSCI EM REIT US 0.233 0.485 -0.538 -0.448 -2.107 -2.087 74.992 50.650 94.051 48.861 162.755 57.006 57.006 104.738 20.326 11.556 HES 0.759 0.455 0.330 10.993 14.533 20.326 11.556 21.425 U.S. Government U.S. Corporate Inv. Grade U.S. Corporate High Yield MSCI USA MSCI EAFE 0.15 0.1 0.05 0.4 0.1 MSCI EM REIT US 0.05 0.1 HES 0.05 Portfolio Allocation Portfolio Return Portfolio Risk 6.95 10.61 Asset Class Data Fund Data . B E F H Alpha for 5 Years -0.07 0.06 1 Asset Name 2 CNR Government Bond Fund:N 3 Old Westbury Fixed Income Fund 4. MetWest High Yield Bond Fund;M 5 Selected American Shares:S 6 ClearBridge Sustainability Leaders Fund; 7 ProFunds Europe 30 ProFund Investor 8 Virtus KAR Emerging Markets Small-Cap Fund; 9 Artisan Developing World Fund;Advisor 10 Real Estate Select Sector SPDR Fund 11 ATAC Rotation Fund;Investor 12 13 14 15 0.14 US Mutual Fund Classification Short-Intermediate U.S. Government Funds Short-Intmdt Investment Grade Debt Funds High Yield Funds Large-Cap Core Funds Large-Cap Core Funds European Region Funds Emerging Markets Funds Emerging Markets Funds Real Estate Funds Absolute Return Funds D Annualised Standard Deviation for 5 Years 1.51 2.39 4.86 18.20 14.21 16.62 15.53 16.62 14.24 17.89 Annualized 5 Year Returns 1.13 2.30 6.92 15.70 20.77 6.14 17.78 26.60 9.68 16.61 0.37 0.38 0.03 0.69 0.92 0.30 0.56 Tracking Error for 5 Years 0.07 2.73 0.45 1.65 1.15 1.73 2.76 2.65 1.64 4.59 Sharpe Ratio for 5 Year -0.01 0.13 0.34 0.21 0.35 0.08 0.28 0.38 0.13 0.23 Required: Jason Wong wishes you to address the following questions and has advised that you should incorporate tables in your answers. 1. (8 marks) The current strategic asset allocation seems too defensive, and Jason feels that his investments can be allocated with higher levels of risk. Suggest improvements to the strategic asset allocation to better address Jason's investment objectives and remains efficient. You must address the allocation of each asset/sub-asset and explain why the allocation should be changed (increased or decreased). The allocation must only be in multiples of 5, such as 5, 10, 15 etc. What is the risk and return of this new Strategic Asset Allocation? 2. (2 marks) Ace Investment team has chosen 2 US large cap equity funds and 2 Emerging market equity funds. However, the allocation between the two US and Emerging market equity funds have not been provided. Based purely on the information provided in the table, explain how you will split the allocation between the 2 US equity fund sand the 2 Emerging market equity funds. 3. (2 marks) Based on your suggested allocation across the 10 funds and using the data from the tab Fund Data, calculate the Return and the Alpha of the portfolio. Assume that the returns and alphas generated by the funds in the past, will continue to be generated in the future


