A.
B. WHY DID THE EPS CHANGE?
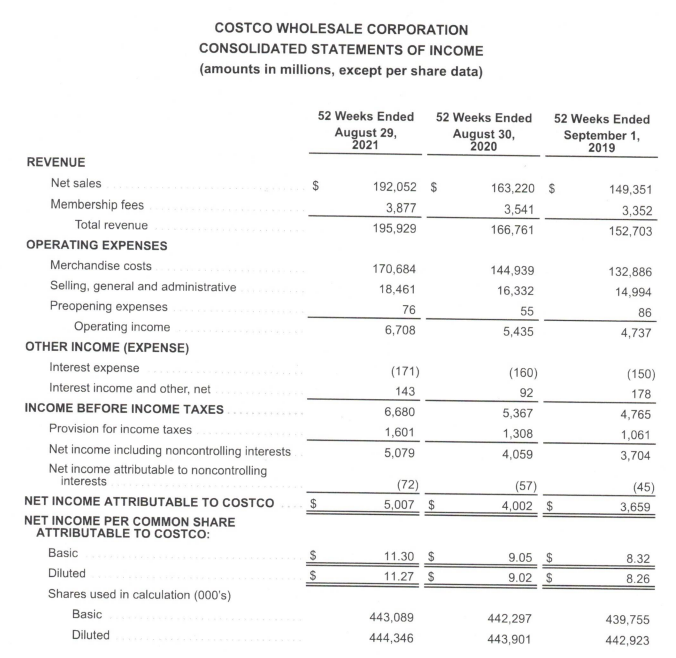
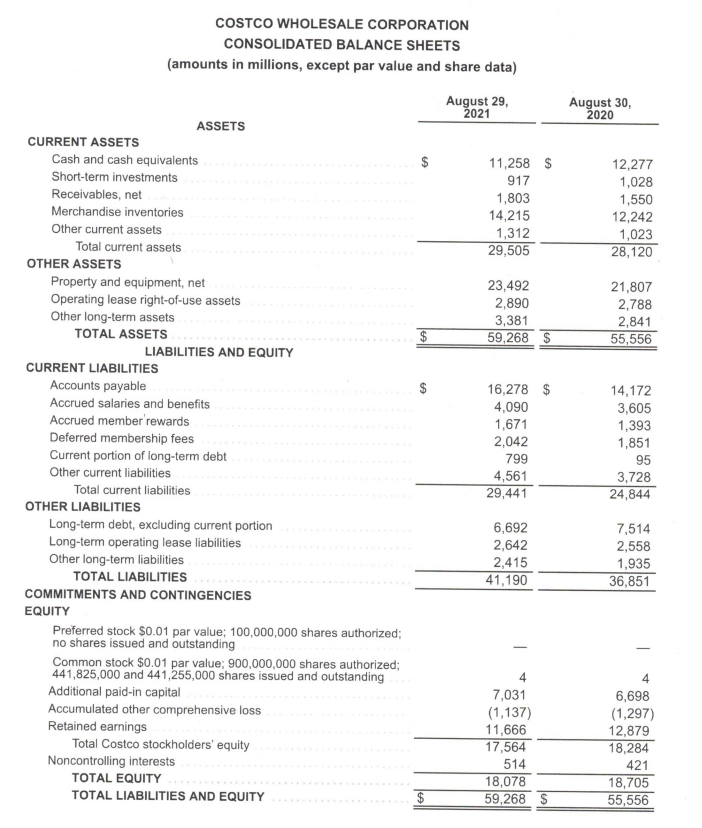
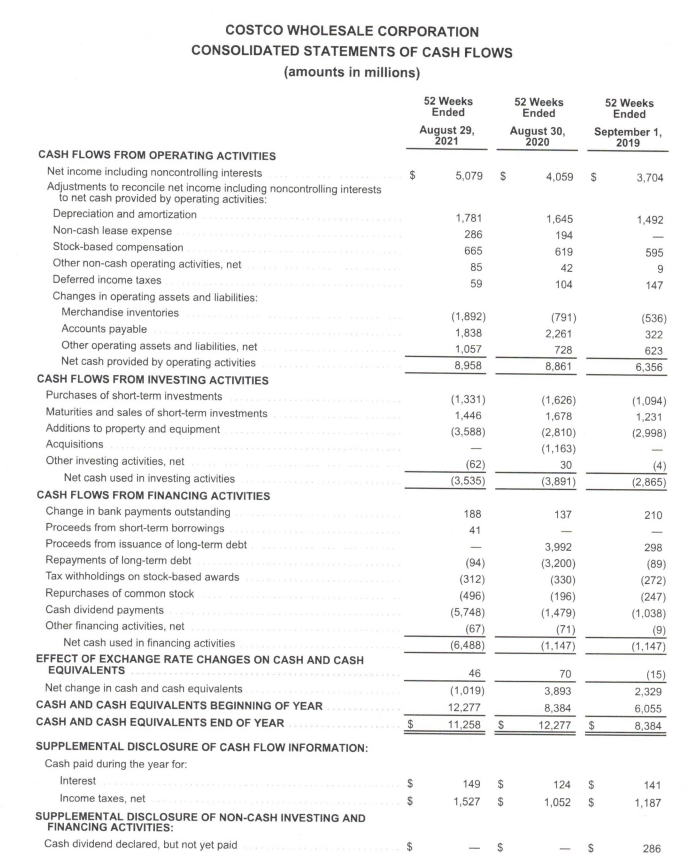
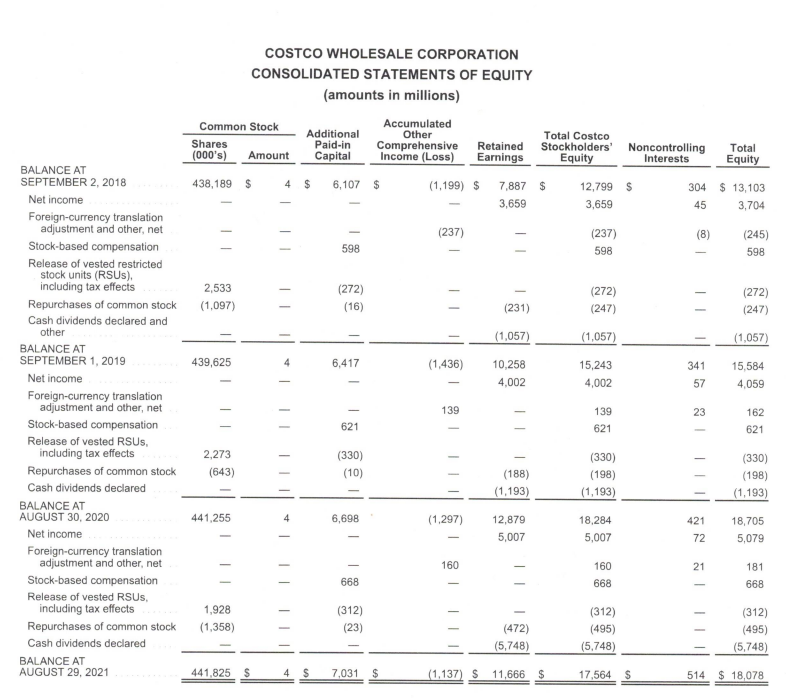
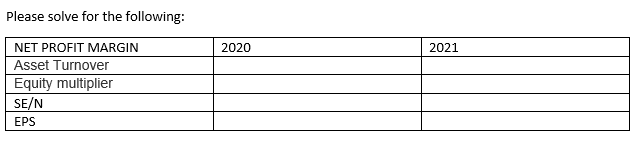
Please solve for the following: NET PROFIT MARGIN Asset Turnover Equity multiplier SE/N EPS 2020 2021 REVENUE COSTCO WHOLESALE CORPORATION CONSOLIDATED STATEMENTS OF INCOME (amounts in millions, except per share data) Net sales Membership fees Total revenue OPERATING EXPENSES Merchandise costs Selling, general and administrative Preopening expenses Operating income OTHER INCOME (EXPENSE) Interest expense Interest income and other, net INCOME BEFORE INCOME TAXES Provision for income taxes Net income including noncontrolling interests Net income attributable to noncontrolling interests NET INCOME ATTRIBUTABLE TO COSTCO NET INCOME PER COMMON SHARE ATTRIBUTABLE TO COSTCO: Basic Diluted Shares used in calculation (000's) Basic Diluted 52 Weeks Ended 52 Weeks Ended August 29, 2021 August 30, 2020 $ $ $ $ 192,052 $ 3,877 195,929 170,684 18,461 76 6,708 (171) 143 6,680 1,601 5,079 (72) 5,007 $ 11.30 $ 11.27 $ 443,089 444,346 163,220 $ 3,541 166,761 144,939 16,332 55 5,435 (160) 92 5,367 1,308 4,059 (57) 4,002 $ 9.05 $ 9.02 $ 52 Weeks Ended September 1, 2019 442,297 443,901 149,351 3,352 152,703 132,886 14,994 86 4,737 (150) 178 4,765 1,061 3,704 (45) 3,659 8.32 8.26 439,755 442,923 CURRENT ASSETS Cash and cash equivalents Short-term investments Receivables, net Merchandise inventories Other current assets Total current assets Property and equipment, net Operating lease right-of-use assets Other long-term assets TOTAL ASSETS CURRENT LIABILITIES Accounts payable Accrued salaries and benefits. Accrued member'rewards Deferred membership fees Current portion of long-term debt Other current liabilities Total current liabilities Long-term debt, excluding current portion Long-term operating lease liabilities Other long-term liabilities TOTAL LIABILITIES COMMITMENTS AND CONTINGENCIES EQUITY Preferred stock $0.01 par value; 100,000,000 shares authorized; no shares issued and outstanding Common stock $0.01 par value; 900,000,000 shares authorized; 441,825,000 and 441,255,000 shares issued and outstanding Additional paid-in capital Accumulated other comprehensive loss Retained earnings Total Costco stockholders' equity Noncontrolling interests TOTAL EQUITY TOTAL LIABILITIES AND EQUITY OTHER ASSETS COSTCO WHOLESALE CORPORATION CONSOLIDATED BALANCE SHEETS (amounts in millions, except par value and share data) August 29, 2021 ASSETS OTHER LIABILITIES LIABILITIES AND EQUITY 11,258 $ 917 1,803 14,215 1,312 29,505 23,492 2,890 3,381 59,268 $ 16,278 $ 4,090 1,671 2,042 799 4,561 29,441 6,692 2,642 2,415 41,190 4 7,031 (1,137) 11,666 17,564 514 18,078 59,268 $ August 30, 2020 12,277 1,028 1,550 12,242 1,023 28,120 21,807 2,788 2,841 55,556 14,172 3,605 1,393 1,851 95 3,728 24,844 7,514 2,558 1,935 36,851 6,698 (1,297) 12,879 18,284 421 18,705 55,556 COSTCO WHOLESALE CORPORATION CONSOLIDATED STATEMENTS OF CASH FLOWS (amounts in millions) 52 Weeks Ended August 29, 2021 CASH FLOWS FROM OPERATING ACTIVITIES Net income including noncontrolling interests Adjustments to reconcile net income including noncontrolling interests to net cash provided by operating activities: Depreciation and amortization Non-cash lease expense Stock-based compensation Other non-cash operating activities, net Deferred income taxes Changes in operating assets and liabilities: Merchandise inventories Accounts payable Other operating assets and liabilities, net Net cash provided by operating activities CASH FLOWS FROM INVESTING ACTIVITIES Purchases of short-term investments Maturities and sales of short-term investments Additions to property and equipment Acquisitions Other investing activities, net Net cash used in investing activities CASH FLOWS FROM FINANCING ACTIVITIES Change in bank payments outstanding Proceeds from short-term borrowings Proceeds from issuance of long-term debt Repayments of long-term debt Tax withholdings on stock-based awards Repurchases of common stock Cash dividend payments Other financing activities, net Net cash used in financing activities EFFECT OF EXCHANGE RATE CHANGES ON CASH AND CASH EQUIVALENTS Net change in cash and cash equivalents CASH AND CASH EQUIVALENTS BEGINNING OF YEAR CASH AND CASH EQUIVALENTS END OF YEAR SUPPLEMENTAL DISCLOSURE OF CASH FLOW INFORMATION: Cash paid during the year for: Interest Income taxes, net SUPPLEMENTAL DISCLOSURE OF NON-CASH INVESTING AND FINANCING ACTIVITIES: Cash dividend declared, but not yet paid $ $ $ $ $ 5,079 1,781 286 665 $ 85 59 (1,892) 1,838 1,057 8,958 (1,331) 1,446 (3,588) (62) (3,535) 188 41 (94) (312) (496) (5,748) (67) (6,488) 46 (1,019) 12,277 11,258 S 149 $ 1,527 $ $ 69 69 52 Weeks Ended August 30, 2020 4,059 1,645 194 619 42 104 (791) 52 Weeks Ended September 1, 2019 $ 3,704 1,492 595 9 147 (536) 322 623 6,356 (1,094) 1,231 (2,998) (2,865) 210 298 2,261 728 8,861 (1,626) 1,678 (2,810) (1,163) 30 (3,891) 137 3,992 (3,200) (330) (196) (1,479) (71) (1,147) 70 3,893 8,384 12,277 $ 124 $ 1,052 50 50 $ $ (89) (272) (247) (1,038) (9) (1,147) (15) 2,329 6,055 8,384 141 1,187 286 BALANCE AT SEPTEMBER 2, 2018 Net income Foreign-currency translation adjustment and other, net Stock-based compensation Release of vested restricted stock units (RSUS), including tax effects Repurchases of common stock Cash dividends declared and other BALANCE AT SEPTEMBER 1, 2019 Net income Foreign-currency translation adjustment and other, net Stock-based compensation Release of vested RSUS, including tax effects Repurchases of common stock Cash dividends declared BALANCE AT AUGUST 30, 2020 Net income Foreign-currency translation adjustment and other, net Stock-based compensation Release of vested RSUS, including tax effects Repurchases of common stock Cash dividends declared BALANCE AT AUGUST 29, 2021 Common Stock Shares (000's) Amount 438,189 $ 2,533 (1,097) 439,625 2,273 (643) 441,255 COSTCO WHOLESALE CORPORATION CONSOLIDATED STATEMENTS OF EQUITY (amounts in millions) Accumulated Other Comprehensive Retained Income (Loss) Earnings (1,199) S (237) (1,436) 139 (1,297) 160 (472) (5,748) (1.137) S 11,666 $ 1,928 (1,358) 441,825 $ 4 $ | | 4 Additional Paid-in Capital T 4 $ 6,107 $ 598 (272) (16) 6,417 621 (330) (10) 6,698 I 668 (312) (23) 7,031 $ Total Costco Stockholders' Noncontrolling Equity Interests 12,799 $ 304 3,659 45 7,887 $ 3,659 (231) (1,057) 10,258 4,002 (188) (1,193) 12,879 5,007 (237) 598 (272) (247) (1,057) 15,243 4,002 139 621 (330) (198) (1,193) 18,284 5,007 160 668 (312) (495) (5,748) 17,564 $ (8) (245) 598 (272) (247) (1,057) 15,584 4,059 162 621 (330) (198) (1,193) 18,705 5,079 181 668 (312) (495) (5,748) 514 $18,078 341 57 23 Total Equity $13,103 3,704 421 72 21 Please solve for the following: NET PROFIT MARGIN Asset Turnover Equity multiplier SE/N EPS 2020 2021 REVENUE COSTCO WHOLESALE CORPORATION CONSOLIDATED STATEMENTS OF INCOME (amounts in millions, except per share data) Net sales Membership fees Total revenue OPERATING EXPENSES Merchandise costs Selling, general and administrative Preopening expenses Operating income OTHER INCOME (EXPENSE) Interest expense Interest income and other, net INCOME BEFORE INCOME TAXES Provision for income taxes Net income including noncontrolling interests Net income attributable to noncontrolling interests NET INCOME ATTRIBUTABLE TO COSTCO NET INCOME PER COMMON SHARE ATTRIBUTABLE TO COSTCO: Basic Diluted Shares used in calculation (000's) Basic Diluted 52 Weeks Ended 52 Weeks Ended August 29, 2021 August 30, 2020 $ $ $ $ 192,052 $ 3,877 195,929 170,684 18,461 76 6,708 (171) 143 6,680 1,601 5,079 (72) 5,007 $ 11.30 $ 11.27 $ 443,089 444,346 163,220 $ 3,541 166,761 144,939 16,332 55 5,435 (160) 92 5,367 1,308 4,059 (57) 4,002 $ 9.05 $ 9.02 $ 52 Weeks Ended September 1, 2019 442,297 443,901 149,351 3,352 152,703 132,886 14,994 86 4,737 (150) 178 4,765 1,061 3,704 (45) 3,659 8.32 8.26 439,755 442,923 CURRENT ASSETS Cash and cash equivalents Short-term investments Receivables, net Merchandise inventories Other current assets Total current assets Property and equipment, net Operating lease right-of-use assets Other long-term assets TOTAL ASSETS CURRENT LIABILITIES Accounts payable Accrued salaries and benefits. Accrued member'rewards Deferred membership fees Current portion of long-term debt Other current liabilities Total current liabilities Long-term debt, excluding current portion Long-term operating lease liabilities Other long-term liabilities TOTAL LIABILITIES COMMITMENTS AND CONTINGENCIES EQUITY Preferred stock $0.01 par value; 100,000,000 shares authorized; no shares issued and outstanding Common stock $0.01 par value; 900,000,000 shares authorized; 441,825,000 and 441,255,000 shares issued and outstanding Additional paid-in capital Accumulated other comprehensive loss Retained earnings Total Costco stockholders' equity Noncontrolling interests TOTAL EQUITY TOTAL LIABILITIES AND EQUITY OTHER ASSETS COSTCO WHOLESALE CORPORATION CONSOLIDATED BALANCE SHEETS (amounts in millions, except par value and share data) August 29, 2021 ASSETS OTHER LIABILITIES LIABILITIES AND EQUITY 11,258 $ 917 1,803 14,215 1,312 29,505 23,492 2,890 3,381 59,268 $ 16,278 $ 4,090 1,671 2,042 799 4,561 29,441 6,692 2,642 2,415 41,190 4 7,031 (1,137) 11,666 17,564 514 18,078 59,268 $ August 30, 2020 12,277 1,028 1,550 12,242 1,023 28,120 21,807 2,788 2,841 55,556 14,172 3,605 1,393 1,851 95 3,728 24,844 7,514 2,558 1,935 36,851 6,698 (1,297) 12,879 18,284 421 18,705 55,556 COSTCO WHOLESALE CORPORATION CONSOLIDATED STATEMENTS OF CASH FLOWS (amounts in millions) 52 Weeks Ended August 29, 2021 CASH FLOWS FROM OPERATING ACTIVITIES Net income including noncontrolling interests Adjustments to reconcile net income including noncontrolling interests to net cash provided by operating activities: Depreciation and amortization Non-cash lease expense Stock-based compensation Other non-cash operating activities, net Deferred income taxes Changes in operating assets and liabilities: Merchandise inventories Accounts payable Other operating assets and liabilities, net Net cash provided by operating activities CASH FLOWS FROM INVESTING ACTIVITIES Purchases of short-term investments Maturities and sales of short-term investments Additions to property and equipment Acquisitions Other investing activities, net Net cash used in investing activities CASH FLOWS FROM FINANCING ACTIVITIES Change in bank payments outstanding Proceeds from short-term borrowings Proceeds from issuance of long-term debt Repayments of long-term debt Tax withholdings on stock-based awards Repurchases of common stock Cash dividend payments Other financing activities, net Net cash used in financing activities EFFECT OF EXCHANGE RATE CHANGES ON CASH AND CASH EQUIVALENTS Net change in cash and cash equivalents CASH AND CASH EQUIVALENTS BEGINNING OF YEAR CASH AND CASH EQUIVALENTS END OF YEAR SUPPLEMENTAL DISCLOSURE OF CASH FLOW INFORMATION: Cash paid during the year for: Interest Income taxes, net SUPPLEMENTAL DISCLOSURE OF NON-CASH INVESTING AND FINANCING ACTIVITIES: Cash dividend declared, but not yet paid $ $ $ $ $ 5,079 1,781 286 665 $ 85 59 (1,892) 1,838 1,057 8,958 (1,331) 1,446 (3,588) (62) (3,535) 188 41 (94) (312) (496) (5,748) (67) (6,488) 46 (1,019) 12,277 11,258 S 149 $ 1,527 $ $ 69 69 52 Weeks Ended August 30, 2020 4,059 1,645 194 619 42 104 (791) 52 Weeks Ended September 1, 2019 $ 3,704 1,492 595 9 147 (536) 322 623 6,356 (1,094) 1,231 (2,998) (2,865) 210 298 2,261 728 8,861 (1,626) 1,678 (2,810) (1,163) 30 (3,891) 137 3,992 (3,200) (330) (196) (1,479) (71) (1,147) 70 3,893 8,384 12,277 $ 124 $ 1,052 50 50 $ $ (89) (272) (247) (1,038) (9) (1,147) (15) 2,329 6,055 8,384 141 1,187 286 BALANCE AT SEPTEMBER 2, 2018 Net income Foreign-currency translation adjustment and other, net Stock-based compensation Release of vested restricted stock units (RSUS), including tax effects Repurchases of common stock Cash dividends declared and other BALANCE AT SEPTEMBER 1, 2019 Net income Foreign-currency translation adjustment and other, net Stock-based compensation Release of vested RSUS, including tax effects Repurchases of common stock Cash dividends declared BALANCE AT AUGUST 30, 2020 Net income Foreign-currency translation adjustment and other, net Stock-based compensation Release of vested RSUS, including tax effects Repurchases of common stock Cash dividends declared BALANCE AT AUGUST 29, 2021 Common Stock Shares (000's) Amount 438,189 $ 2,533 (1,097) 439,625 2,273 (643) 441,255 COSTCO WHOLESALE CORPORATION CONSOLIDATED STATEMENTS OF EQUITY (amounts in millions) Accumulated Other Comprehensive Retained Income (Loss) Earnings (1,199) S (237) (1,436) 139 (1,297) 160 (472) (5,748) (1.137) S 11,666 $ 1,928 (1,358) 441,825 $ 4 $ | | 4 Additional Paid-in Capital T 4 $ 6,107 $ 598 (272) (16) 6,417 621 (330) (10) 6,698 I 668 (312) (23) 7,031 $ Total Costco Stockholders' Noncontrolling Equity Interests 12,799 $ 304 3,659 45 7,887 $ 3,659 (231) (1,057) 10,258 4,002 (188) (1,193) 12,879 5,007 (237) 598 (272) (247) (1,057) 15,243 4,002 139 621 (330) (198) (1,193) 18,284 5,007 160 668 (312) (495) (5,748) 17,564 $ (8) (245) 598 (272) (247) (1,057) 15,584 4,059 162 621 (330) (198) (1,193) 18,705 5,079 181 668 (312) (495) (5,748) 514 $18,078 341 57 23 Total Equity $13,103 3,704 421 72 21