55 Lobster fishing study. The Bulletin of Marine Science (April 2010) performed a study of teams of...
Question:
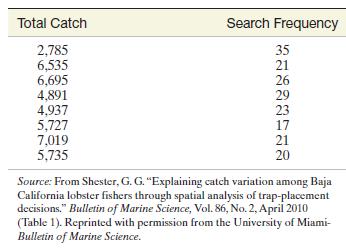
55 Lobster fishing study. The Bulletin of Marine Science (April 2010) performed a study of teams of fishermen fishing for the red spiny lobster in Baja California Sur, Mexico. Two variables measured for each of 8 teams from the Punta Abreojos (PA) fishing cooperative were y = total catch of lobsters (in kilograms) during the season and x = average percentage of traps allocated per day to exploring areas of unknown catch (called search frequency ). These data, saved in the TRAPSPACE file, are listed in the table.
a. Graph the data in a scatterplot. What type of trend, if any, do you observe?
b. A simple linear regression analysis was conducted using SAS. Find the least squares prediction equation on the accompanying SAS printout. Interpret the slope of the least squares line.
c. Give the null and alternative hypothesis for testing whether total catch ( y ) is negatively linearly related to search frequency ( x ).
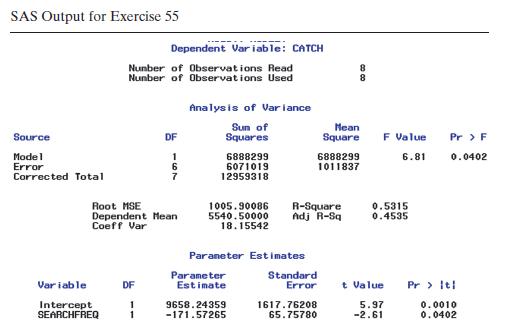
d. Find the p -value of the test, part c , on the SAS printout.
e. Give the appropriate conclusion of the test, part c , using a = .05 .
Step by Step Answer:

This question has not been answered yet.
You can Ask your question!