A board member is interested in the utilization breakeven of the Center. What are the breakeven values of the three input variables that are highly uncertain? What management information is provided by the breakeven analysis? Break-even analysis is the study of the number of procedures (utilization) required to break even considering all fixed and variable costs. The three input variables are number of procedures per day, average revenue per day, and the building and equipment salvage value. Fixed costs are those that do not change given the number of procedures; the variable costs do change given the number of procedures.
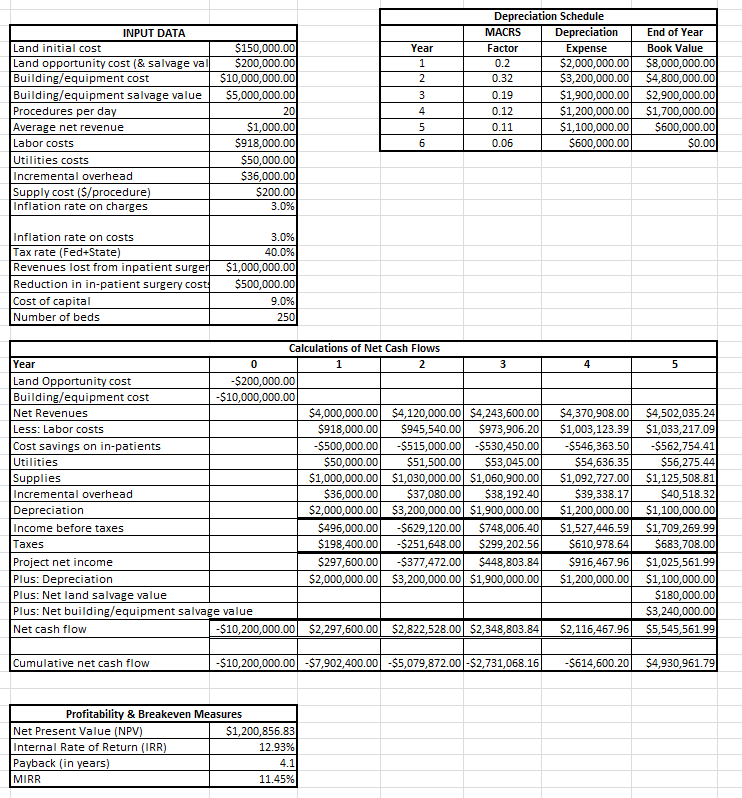
\begin{tabular}{|l|r|} \hline \multicolumn{2}{|c|}{ INPUT DATA } \\ \hline Land initial cost & $150,000.00 \\ \hline Land opportunity cost (\& salvage va & $200,000.00 \\ \hline Building/equipment cost & $10,000,000.00 \\ \hline Building/equipment salvage value & $5,000,000.00 \\ \hline Procedures per day & 20 \\ \hline Average net revenue & $1,000.00 \\ \hline Labor costs & $918,000.00 \\ \hline Utilities costs & $50,000.00 \\ \hline Incremental overhead & $36,000.00 \\ \hline Supply cost (\$/procedure) & $200.00 \\ \hline Inflation rate on charges & 3.0% \\ \hline & \\ Inflation rate on costs & 3.0% \\ \hline Tax rate (Fed+State) & 40.0% \\ \hline Revenues lost from inpatient surger & $1,000,000.00 \\ \hline Reduction in in-patient surgery cost & $500,000.00 \\ \hline Cost of capital & 9.0% \\ \hline Number of beds & 250 \\ \hline \end{tabular} \begin{tabular}{|c|c|r|r|} \hline \multicolumn{4}{|c|}{ Depreciation Schedule } \\ \hline & MACRS & \multicolumn{1}{|c|}{ Depreciation } & End of Year \\ \hline Year & Factor & \multicolumn{1}{|c|}{ Expense } & Book Value \\ \hline 1 & 0.2 & $2,000,000.00 & $8,000,000.00 \\ \hline 2 & 0.32 & $3,200,000.00 & $4,800,000.00 \\ \hline 3 & 0.19 & $1,900,000.00 & $2,900,000.00 \\ \hline 4 & 0.12 & $1,200,000.00 & $1,700,000.00 \\ \hline 5 & 0.11 & $1,100,000.00 & $600,000.00 \\ \hline 6 & 0.06 & $600,000.00 & $0.00 \\ \hline \end{tabular} \begin{tabular}{|l|r|} \hline \multicolumn{2}{|c|}{ Profitability \& Breakeven Measures } \\ \hline Net Present Value (NPV) & $1,200,856.83 \\ \hline Internal Rate of Return (IRR) & 12.93% \\ \hline Payback (in years) & 4.1 \\ \hline MIRR & 11.45% \\ \hline \end{tabular} \begin{tabular}{|l|r|} \hline \multicolumn{2}{|c|}{ INPUT DATA } \\ \hline Land initial cost & $150,000.00 \\ \hline Land opportunity cost (\& salvage va & $200,000.00 \\ \hline Building/equipment cost & $10,000,000.00 \\ \hline Building/equipment salvage value & $5,000,000.00 \\ \hline Procedures per day & 20 \\ \hline Average net revenue & $1,000.00 \\ \hline Labor costs & $918,000.00 \\ \hline Utilities costs & $50,000.00 \\ \hline Incremental overhead & $36,000.00 \\ \hline Supply cost (\$/procedure) & $200.00 \\ \hline Inflation rate on charges & 3.0% \\ \hline & \\ Inflation rate on costs & 3.0% \\ \hline Tax rate (Fed+State) & 40.0% \\ \hline Revenues lost from inpatient surger & $1,000,000.00 \\ \hline Reduction in in-patient surgery cost & $500,000.00 \\ \hline Cost of capital & 9.0% \\ \hline Number of beds & 250 \\ \hline \end{tabular} \begin{tabular}{|c|c|r|r|} \hline \multicolumn{4}{|c|}{ Depreciation Schedule } \\ \hline & MACRS & \multicolumn{1}{|c|}{ Depreciation } & End of Year \\ \hline Year & Factor & \multicolumn{1}{|c|}{ Expense } & Book Value \\ \hline 1 & 0.2 & $2,000,000.00 & $8,000,000.00 \\ \hline 2 & 0.32 & $3,200,000.00 & $4,800,000.00 \\ \hline 3 & 0.19 & $1,900,000.00 & $2,900,000.00 \\ \hline 4 & 0.12 & $1,200,000.00 & $1,700,000.00 \\ \hline 5 & 0.11 & $1,100,000.00 & $600,000.00 \\ \hline 6 & 0.06 & $600,000.00 & $0.00 \\ \hline \end{tabular} \begin{tabular}{|l|r|} \hline \multicolumn{2}{|c|}{ Profitability \& Breakeven Measures } \\ \hline Net Present Value (NPV) & $1,200,856.83 \\ \hline Internal Rate of Return (IRR) & 12.93% \\ \hline Payback (in years) & 4.1 \\ \hline MIRR & 11.45% \\ \hline \end{tabular}