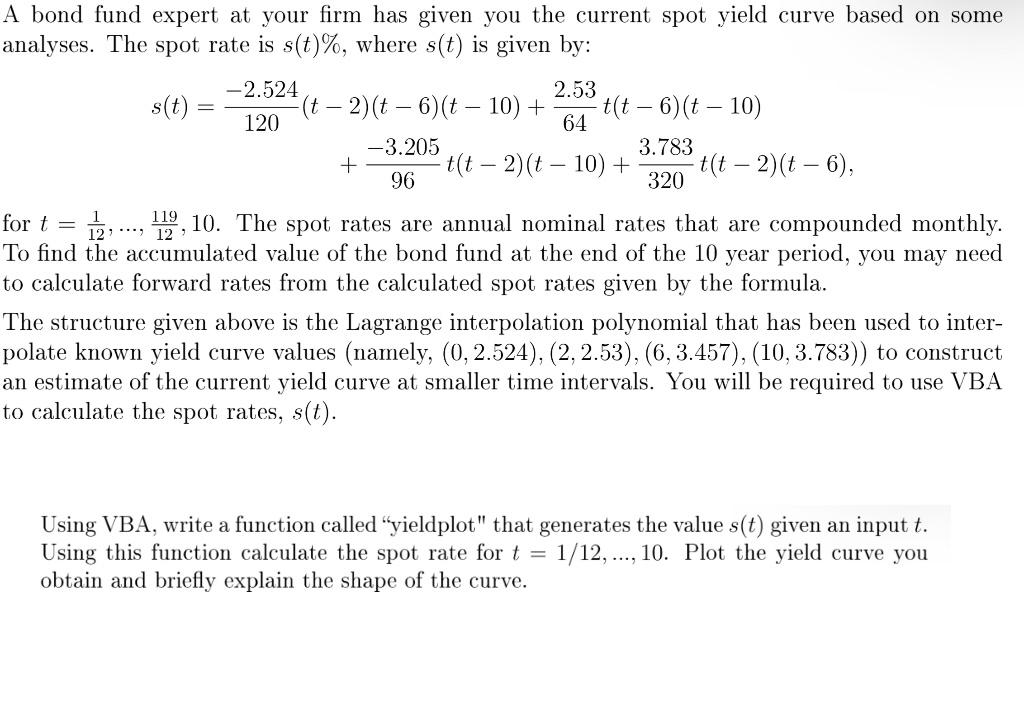
A bond fund expert at your firm has given you the current spot yield curve based on some analyses. The spot rate is s(t)%, where s(t) is given by: -2.524 2.53 (t - 2)(t-6)(t 10) + -t(t - 6)(t 10) 120 64 -3.205 3.783 + t(t 2)(t 10) + t(t 2)(t 6), 96 320 - 12 ..., fort 119, 10. The spot rates are annual nominal rates that are compounded monthly. To find the accumulated value of the bond fund at the end of the 10 year period, you may need to calculate forward rates from the calculated spot rates given by the formula. The structure given above is the Lagrange interpolation polynomial that has been used to inter- polate known yield curve values (namely, (0, 2.524), (2, 2.53), (6, 3.457), (10, 3.783)) to construct an estimate of the current yield curve at smaller time intervals. You will be required to use VBA to calculate the spot rates, s(t). Using VBA, write a function called "yieldplot" that generates the value s(t) given an input t. Using this function calculate the spot rate for t = 1/12, ..., 10. Plot the yield curve you obtain and briefly explain the shape of the curve. A bond fund expert at your firm has given you the current spot yield curve based on some analyses. The spot rate is s(t)%, where s(t) is given by: -2.524 2.53 (t - 2)(t-6)(t 10) + -t(t - 6)(t 10) 120 64 -3.205 3.783 + t(t 2)(t 10) + t(t 2)(t 6), 96 320 - 12 ..., fort 119, 10. The spot rates are annual nominal rates that are compounded monthly. To find the accumulated value of the bond fund at the end of the 10 year period, you may need to calculate forward rates from the calculated spot rates given by the formula. The structure given above is the Lagrange interpolation polynomial that has been used to inter- polate known yield curve values (namely, (0, 2.524), (2, 2.53), (6, 3.457), (10, 3.783)) to construct an estimate of the current yield curve at smaller time intervals. You will be required to use VBA to calculate the spot rates, s(t). Using VBA, write a function called "yieldplot" that generates the value s(t) given an input t. Using this function calculate the spot rate for t = 1/12, ..., 10. Plot the yield curve you obtain and briefly explain the shape of the curve


