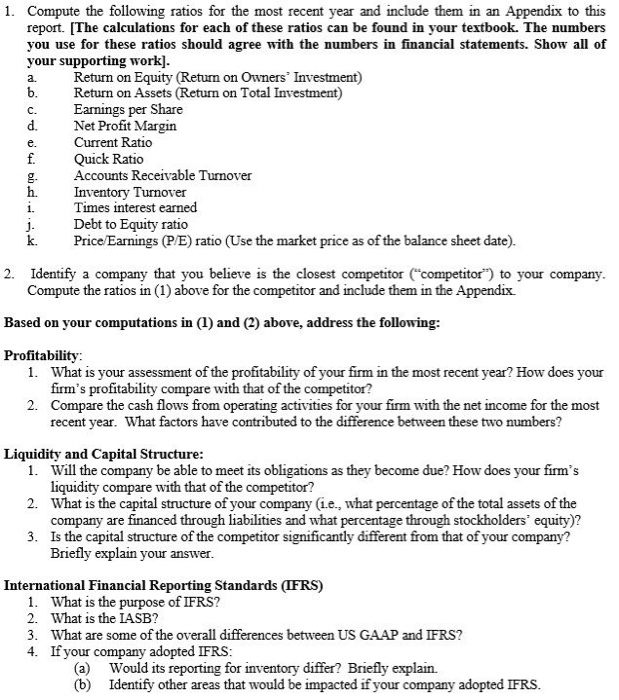
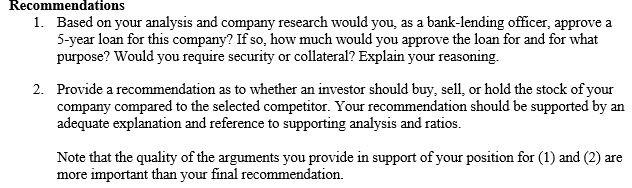
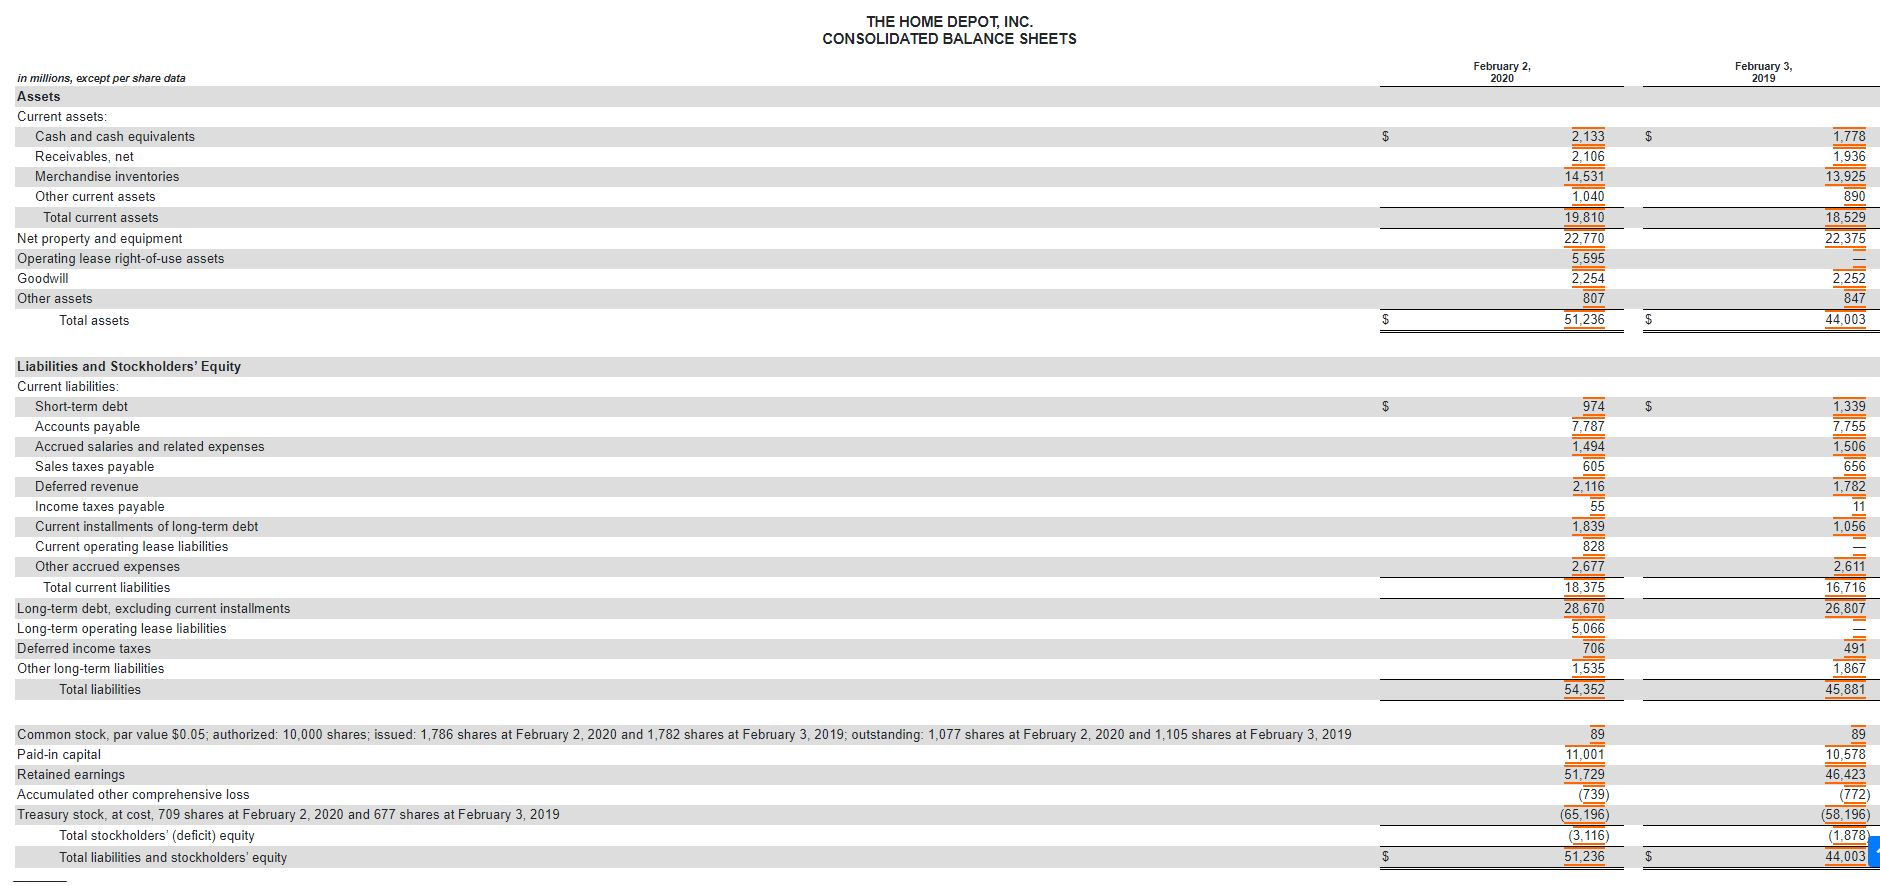
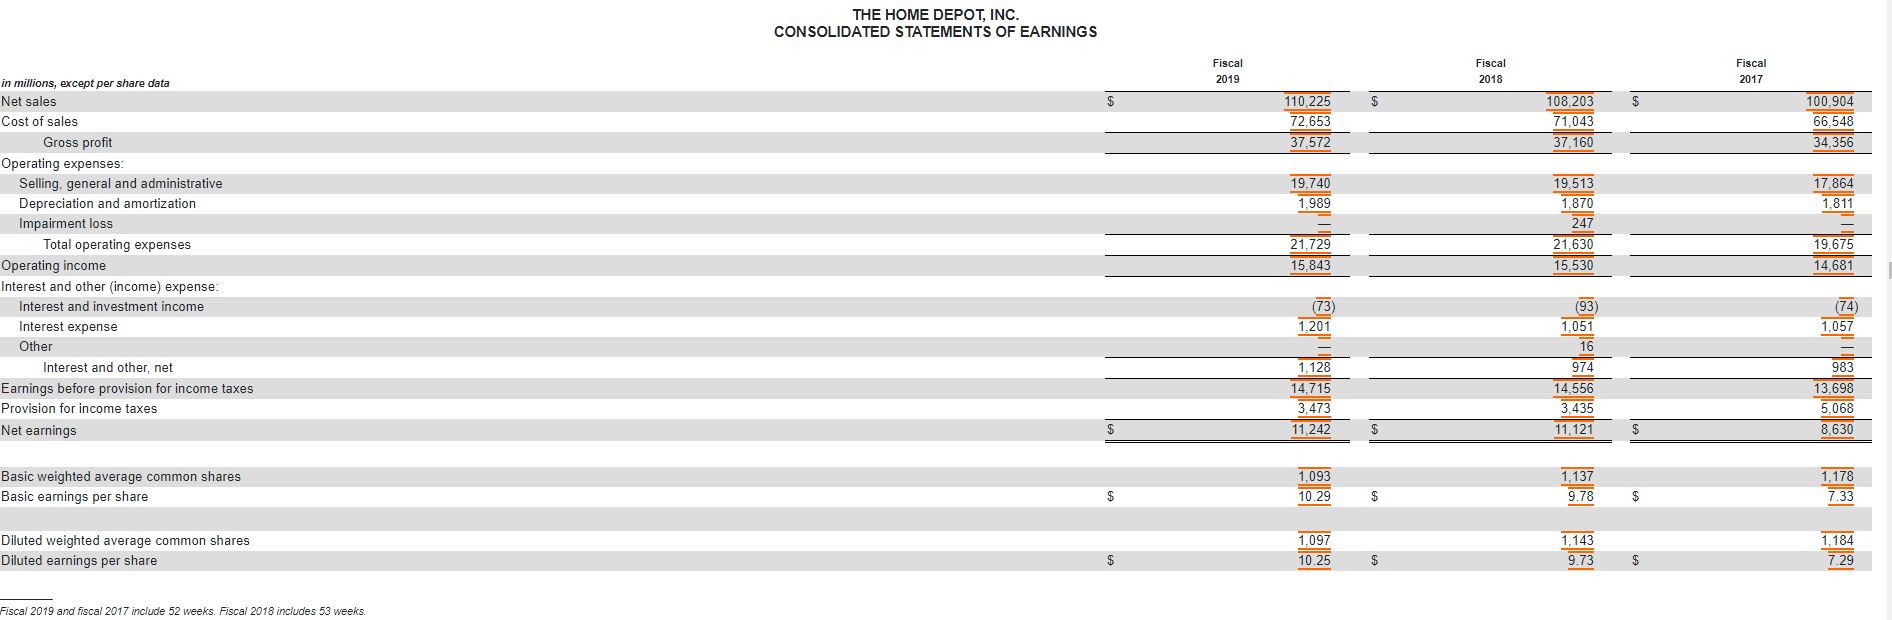
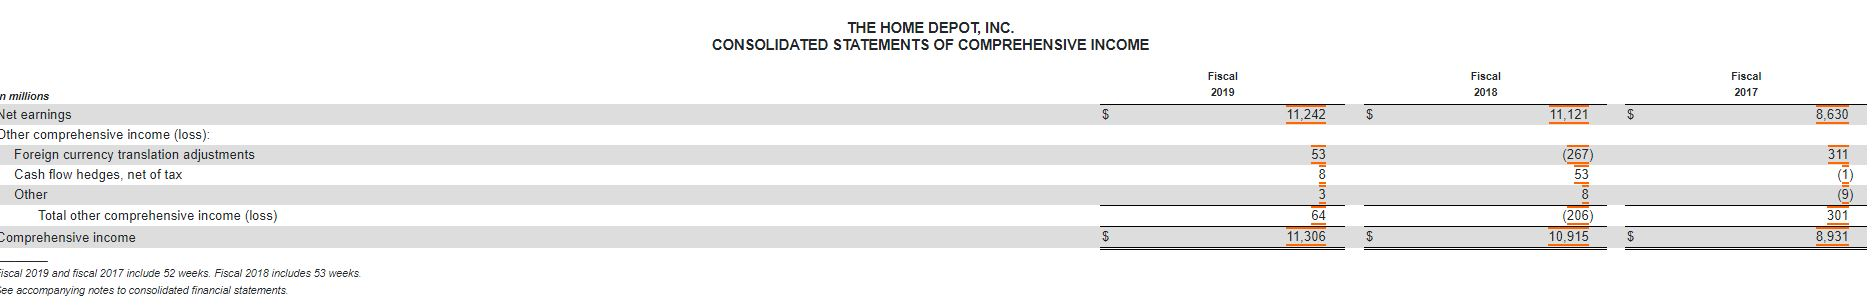
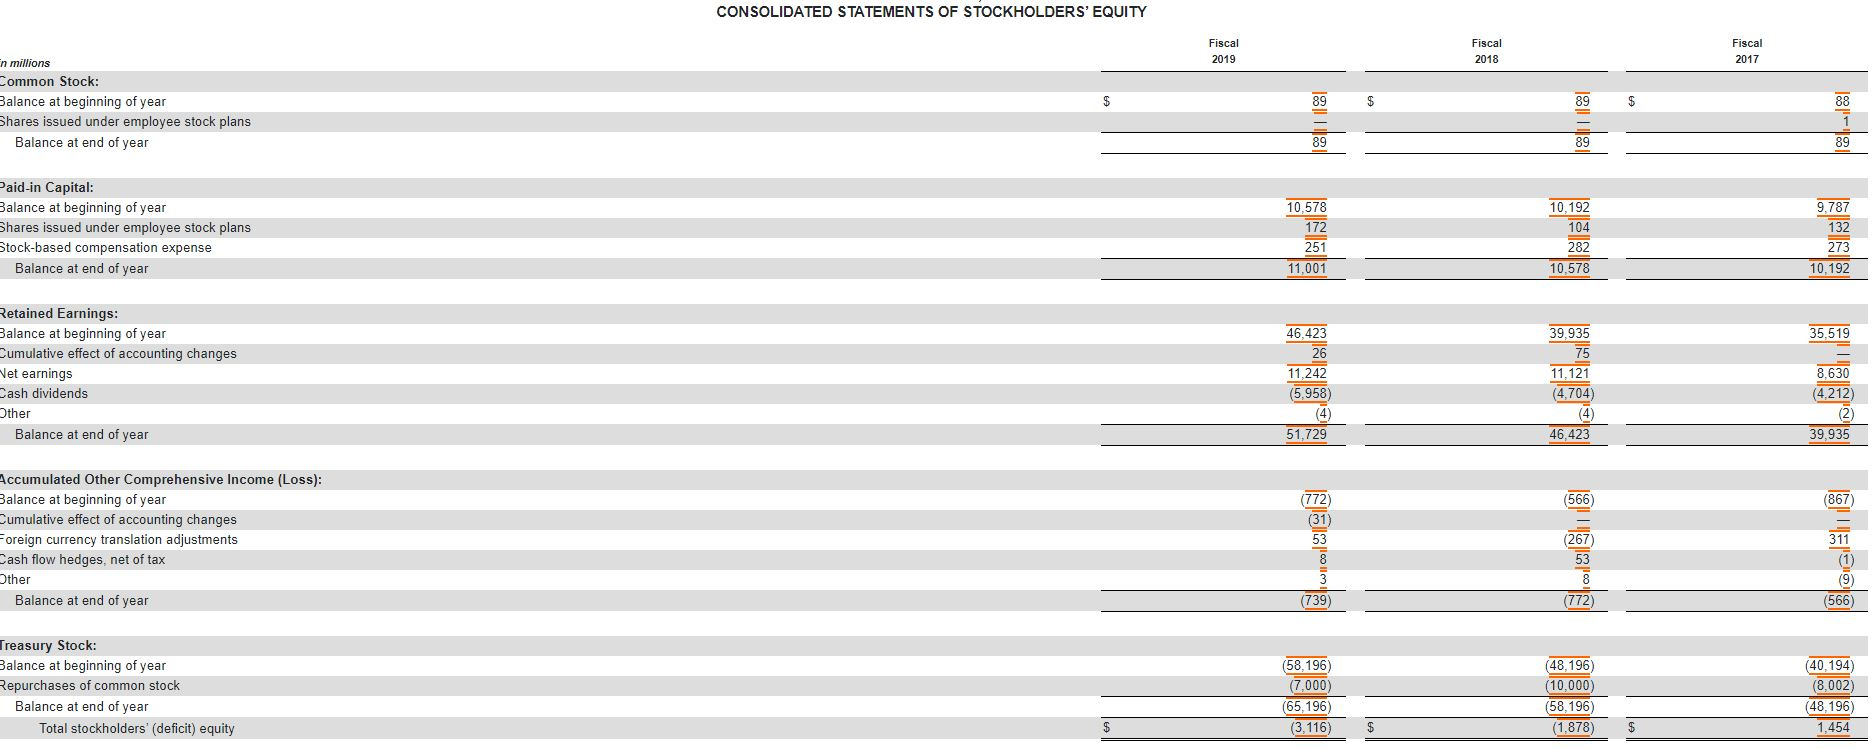
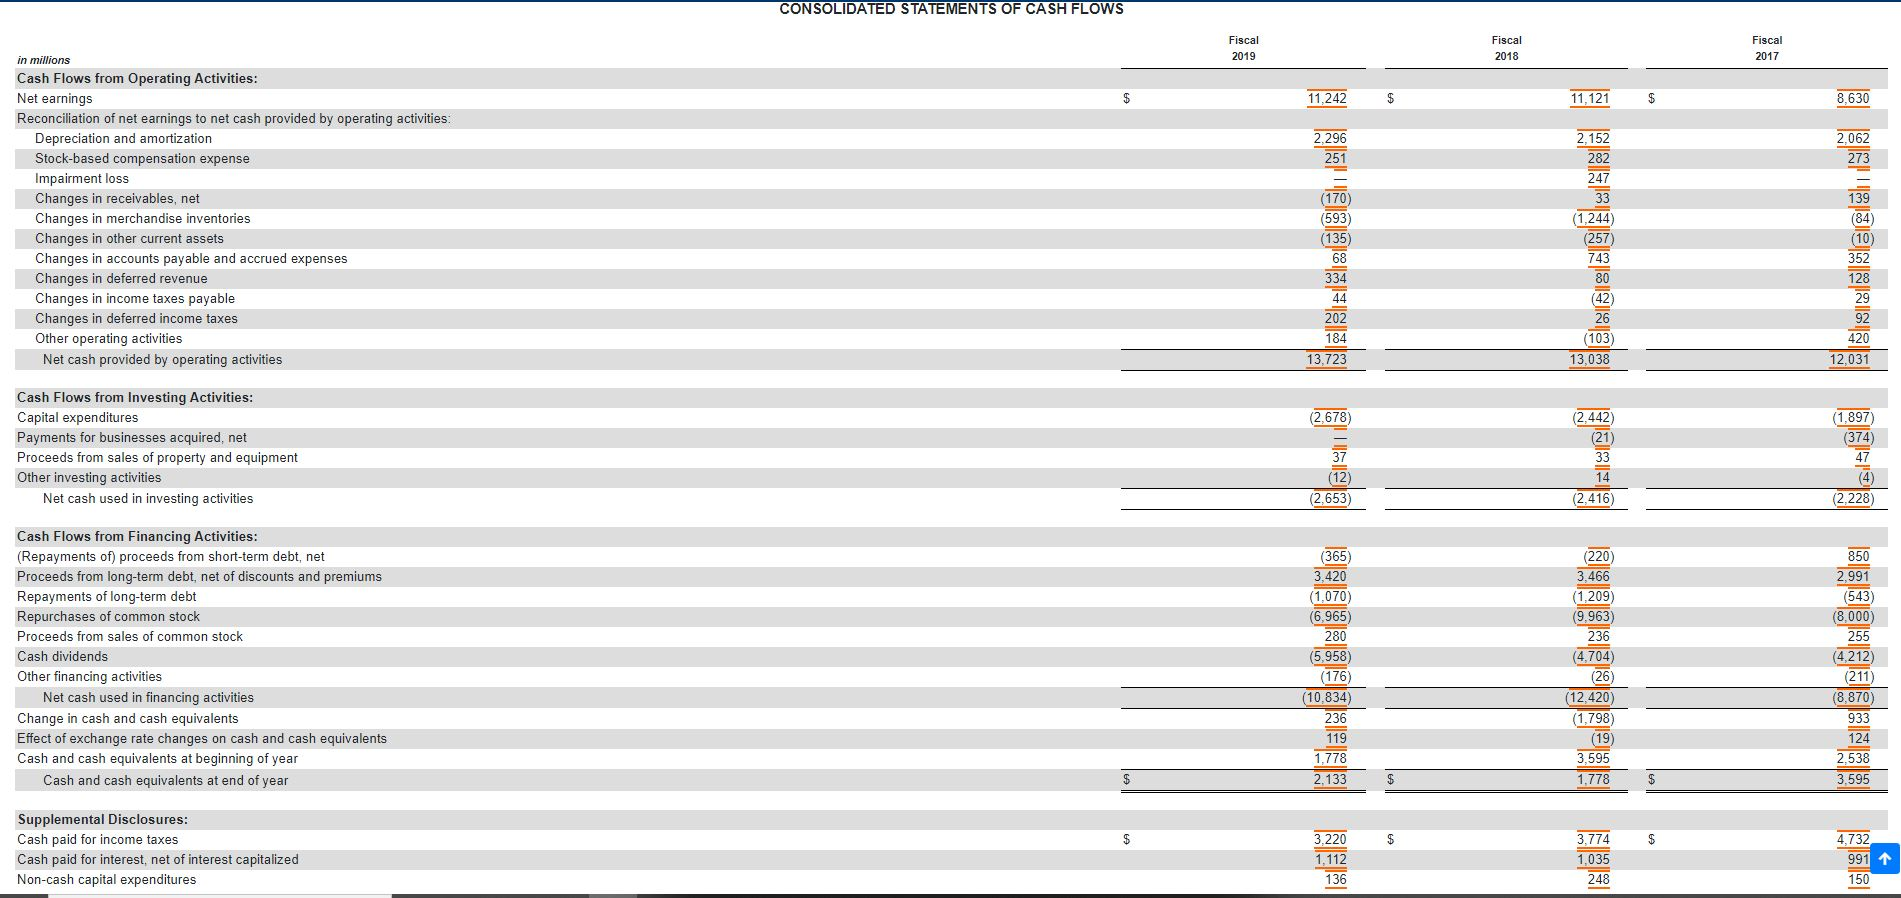
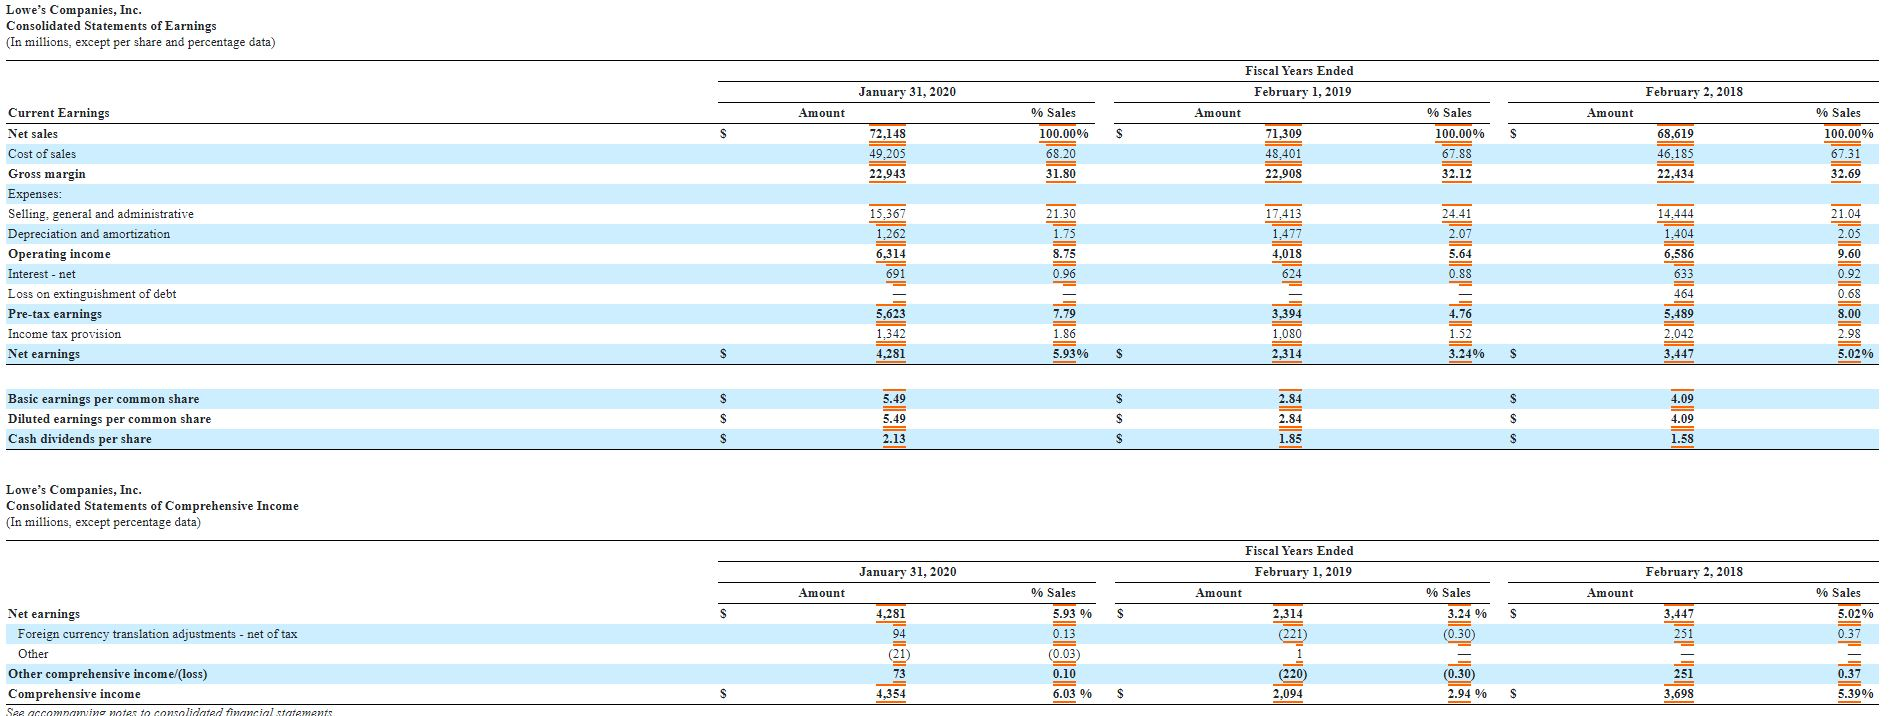
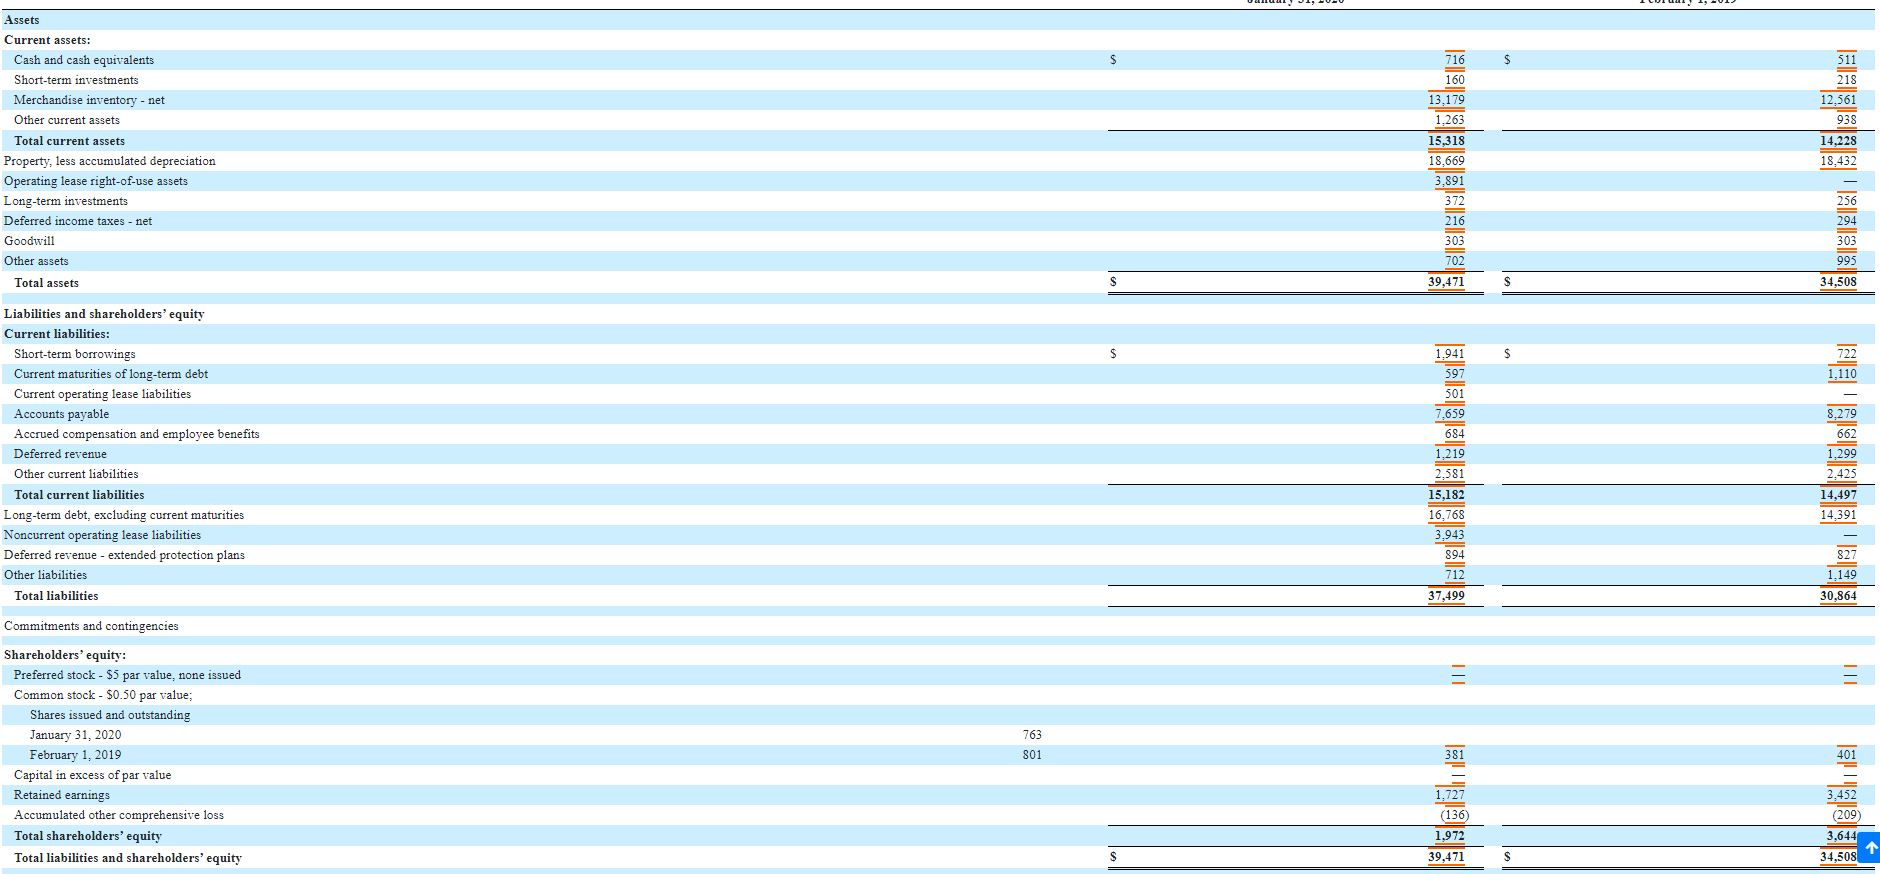
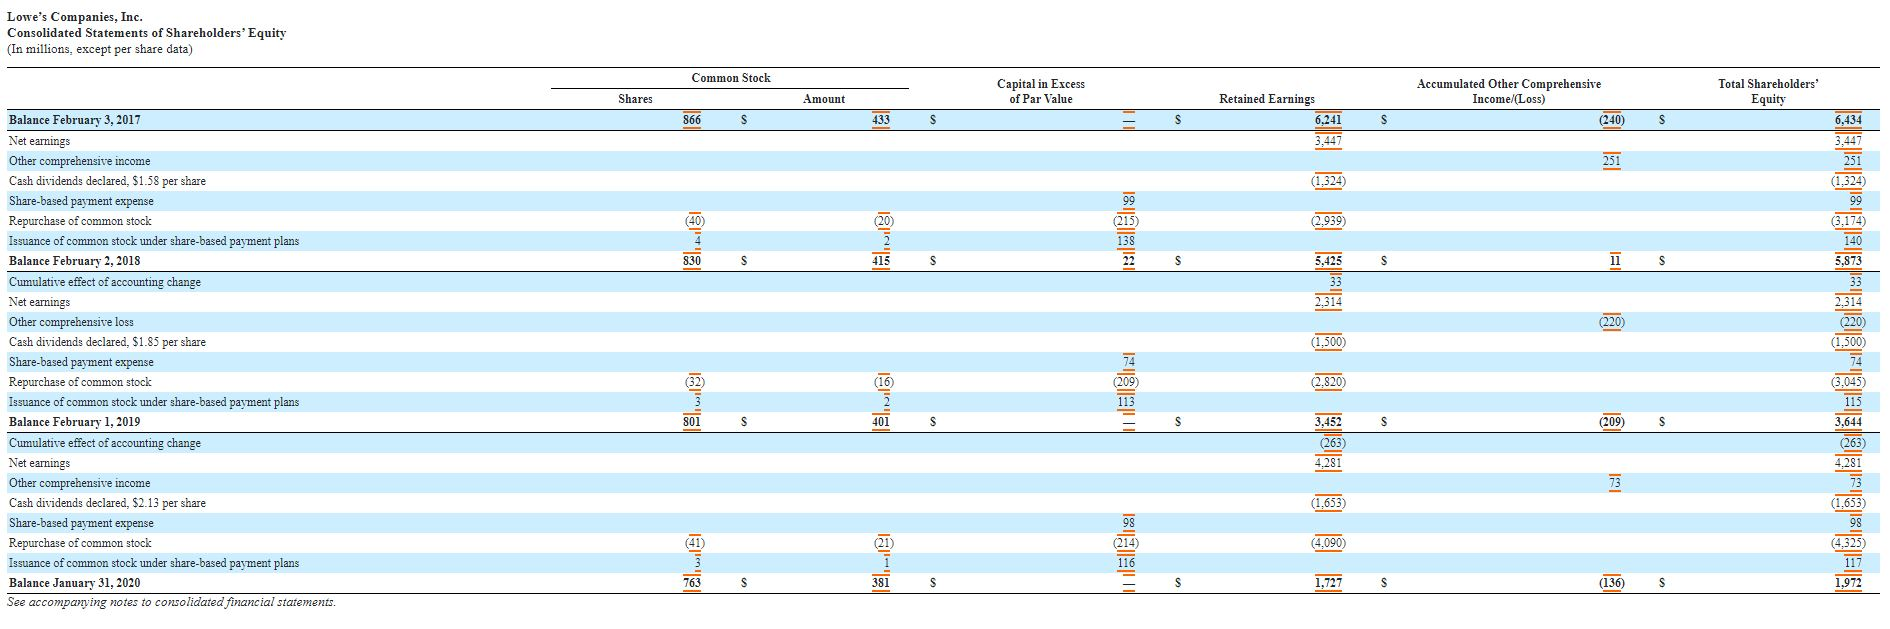
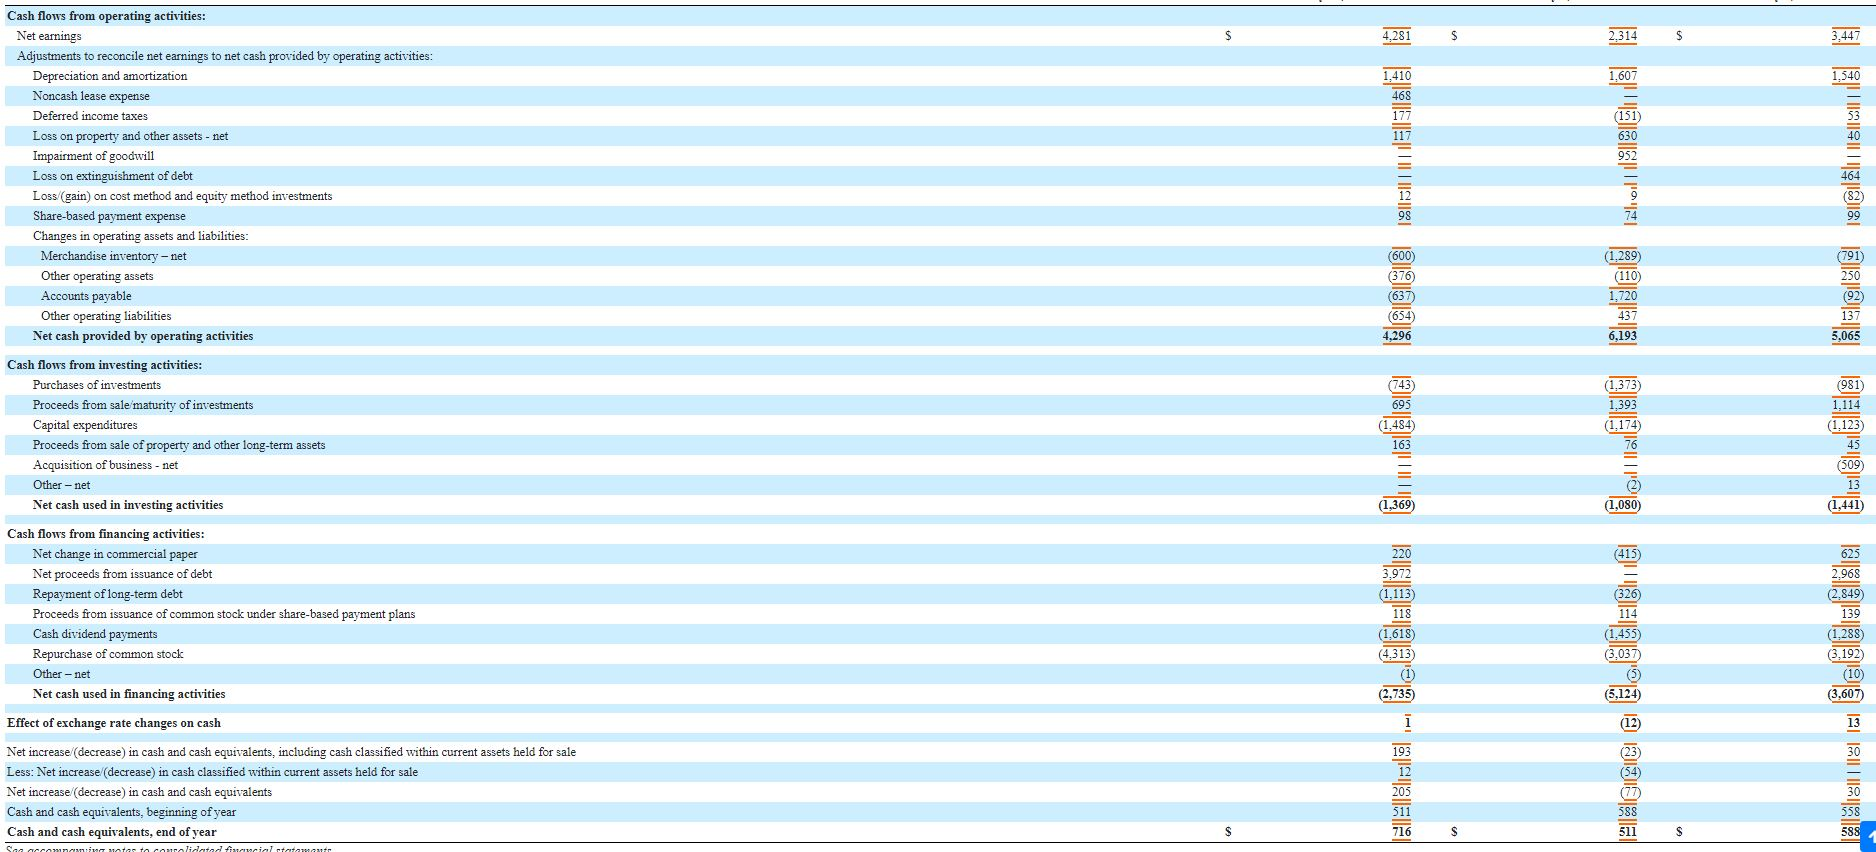
a. C. e. 1. Compute the following ratios for the most recent year and include them in an Appendix to this report. [The calculations for each of these ratios can be found in your textbook. The numbers you use for these ratios should agree with the numbers in financial statements. Show all of your supporting work]. Return on Equity (Return on Owners' Investment) b. Return on Assets (Return on Total Investment) Earnings per Share d. Net Profit Margin Current Ratio f. Quick Ratio Accounts Receivable Turnover h. Inventory Turnover Times interest earned J. Debt to Equity ratio k. Price/Earnings (P/E) ratio (Use the market price as of the balance sheet date). 2. Identify a company that you believe is the closest competitor ("competitor") to your company. Compute the ratios in (1) above for the competitor and include them in the Appendix Based on your computations in (1) and (2) above, address the following: Profitability: 1. What is your assessment of the profitability of your firm in the most recent year? How does your firm's profitability compare with that of the competitor? 2. Compare the cash flows from operating activities for your firm with the net income for the most recent year. What factors have contributed to the difference between these two numbers? Liquidity and Capital Structure: 1. Will the company be able to meet its obligations as they become due? How does your firm's liquidity compare with that of the competitor? 2. What is the capital structure of your company (1.e., what percentage of the total assets of the company are financed through liabilities and what percentage through stockholders' equity)? 3. Is the capital structure of the competitor significantly different from that of your company? Briefly explain your answer. International Financial Reporting Standards (IFRS) 1. What is the purpose of IFRS? 2. What is the IASB? 3. What are some of the overall differences between US GAAP and IFRS? 4. If your company adopted IFRS: (a) Would its reporting for inventory differ? Briefly explain (b) Identify other areas that would be impacted if your company adopted IFRS. Recommendations 1. Based on your analysis and company research would you, as a bank-lending officer, approve a 5-year loan for this company? If so, how much would you approve the loan for and for what purpose? Would you require security or collateral? Explain your reasoning. 2. Provide a recommendation as to whether an investor should buy, sell, or hold the stock of your company compared to the selected competitor. Your recommendation should be supported by an adequate explanation and reference to supporting analysis and ratios. Note that the quality of the arguments you provide in support of your position for (1) and (2) are more important than your final recommendation. THE HOME DEPOT, INC. CONSOLIDATED BALANCE SHEETS February 2, 2020 February 3, 2019 $ 1,778 in millions, except per share data Assets Current assets: Cash and cash equivalents Receivables, net Merchandise inventories Other current assets Total current assets Net property and equipment Operating lease right-of-use assets Goodwill Other assets Total assets 2.133 2,106 14.531 1.040 19,810 22.770 5.595 2.254 807 51,236 1,936 13.925 890 18.529 22,375 2.252 847 44,003 $ $ 974 7,787 1.494 605 2.116 55 Liabilities and Stockholders' Equity Current liabilities: Short-term debt Accounts payable Accrued salaries and related expenses Sales taxes payable Deferred revenue Income taxes payable Current installments of long-term debt Current operating lease liabilities Other accrued expenses Total current liabilities Long-term debt, excluding current installments Long-term operating lease liabilities Deferred income taxes Other long-term liabilities Total liabilities 1,339 7,755 1,506 656 1,782 11 1.056 1.839 828 2,677 18,375 28,670 5,066 706 2.611 16.716 26,807 491 1,535 1,867 54.352 45,881 Common stock, par value $0.05; authorized: 10.000 shares; issued: 1,786 shares at February 2, 2020 and 1,782 shares at February 3, 2019, outstanding: 1,077 shares at February 2, 2020 and 1,105 shares at February 3, 2019 Paid-in capital Retained earnings Accumulated other comprehensive loss Treasury stock, at cost, 709 shares at February 2, 2020 and 677 shares at February 3, 2019 Total stockholders' (deficit) equity Total liabilities and stockholders' equity 89 11.001 51,729 (739) (65,196) (3,116) 51,236 89 10,578 46,423 (772) (58, 196) (1,878 44,003 $ THE HOME DEPOT, INC. CONSOLIDATED STATEMENTS OF EARNINGS Fiscal 2019 Fiscal 2018 Fiscal 2017 $ $ 110,225 72.653 37.572 108,203 71,043 37.160 100,904 66,548 34.356 19.740 1,989 17.864 1,811 in millions, except per share data Net sales Cost of sales Gross profit Operating expenses: Selling, general and administrative Depreciation and amortization Impairment loss Total operating expenses Operating income Interest and other income) expense: Interest and investment income Interest expense Other Interest and other, net Earnings before provision for income taxes Provision for income taxes Net earnings 19.513 1,870 247 21.630 15.530 21,729 15,843 19.675 14,681 (73) 1.201 (74) 1,057 (93) 1,051 16 974 14.556 983 13,698 1.128 14,715 3,473 11.242 3,435 5,068 $ $ 11.121 $ 8.630 1,137 Basic weighted average common shares Basic earnings per share 1,093 10.29 1,178 7.33 $ $ 9.78 $ 1,097 1,143 1,184 Diluted weighted average common shares Diluted earnings per share 10.25 9.73 $ 7.29 Fiscal 2019 and fiscal 2017 include 52 weeks. Fiscal 2018 includes 53 weeks. THE HOME DEPOT, INC. CONSOLIDATED STATEMENTS OF COMPREHENSIVE INCOME Fiscal 2019 Fiscal 2018 Fiscal 2017 11,242 $ 11,121 8.630 53 n millions et earnings Other comprehensive income (loss): Foreign currency translation adjustments Cash flow hedges, net of tax Other Total other comprehensive income (loss) Comprehensive income 8 (267) 53 8 311 (1 (9) 301 64 (206) $ 11.306 $ 10,915 $ 8.931 iscal 2019 and fiscal 2017 include 52 weeks. Fiscal 2018 includes 53 weeks Fee accompanying notes consolidated financial statements CONSOLIDATED STATEMENTS OF STOCKHOLDERS' EQUITY Fiscal 2019 Fiscal 2018 Fiscal 2017 in millions Common Stock: Balance at beginning of year Shares issued under employee stock plans Balance at end of year $ 89 $ 89 $ 88 89 89 Paid-in Capital: Balance at beginning of year Shares issued under employee stock plans Stock-based compensation expense Balance at end of year 10.578 172 251 11.001 10,192 104 282 10.578 9,787 132 273 10.192 35,519 Retained Earnings: Balance at beginning of year Cumulative effect of accounting changes Net earnings Cash dividends Other Balance at end of year 46.423 26 11,242 (5,958) (4) 39.935 75 11.121 (4.704) (4) 8.630 (4.212 (2 39.935 51,729 46,423 (566) (867) Accumulated Other Comprehensive Income (Loss): Balance at beginning of year Cumulative effect of accounting changes Foreign currency translation adjustments Cash flow hedges, net of tax Other Balance at end of year 311 (772) (31 53 8 3 (739) (267) 53 8 (772) (1 (9) (566) Treasury Stock: Balance at beginning of year Repurchases of common stock Balance at end of year Total stockholders' (deficit) equity (58,196) (7,000) (65,196) (3,116) (48,196) (10,000) (58,196) (1.878) (40,194) (8,002 (48,196) 1,454 CONSOLIDATED STATEMENTS OF CASH FLOWS Fiscal 2019 Fiscal 2018 Fiscal 2017 $ 11.242 $ 11.121 $ 8.630 2.296 251 2.062 273 139 in millions Cash Flows from Operating Activities: Net earnings Reconciliation of net earnings to net cash provided by operating activities: Depreciation and amortization Stock-based compensation expense Impairment loss Changes in receivables, net Changes in merchandise inventories Changes in other current assets Changes in accounts payable and accrued expenses Changes in deferred revenue Changes in income taxes payable Changes in deferred income taxes Other operating activities Net cash provided by operating activities 2,152 282 247 33 (1,244) (257 743 80 (170) (593) (135) 68 334 44 202 184 13,723 (84 (42) (10) 352 128 29 92 420 12,031 26 (103) 13.038 (2,678) Cash Flows from Investing Activities: Capital expenditures Payments for businesses acquired, net Proceeds from sales of property and equipment Other investing activities Net cash used in investing activities (2,442) (21 33 37 (12 (2,653) (1,897 (374) 47 (4) (2,228) (2,416) (365) (220) 3.466 (1,209) Cash Flows from Financing Activities: (Repayments of) proceeds from short-term debt, net Proceeds from long-term debt, net of discounts and premiums Repayments of long-term debt Repurchases of common stock Proceeds from sales of common stock Cash dividends Other financing activities Net cash used in financing activities Change in cash and cash equivalents Effect of exchange rate changes on cash and cash equivalents Cash and cash equivalents at beginning of year Cash and cash equivalents at end of year 3,420 (1,070) (6,965) 280 (5,958) (176) (10.834) 236 (9.963) 236 (4.704) (26) (12,420 (1,798) (19 3,595 1,778 850 2.991 (543) (8,000 255 (4,212 (211) (8,870) 933 124 2.538 3,595 119 1,778 2,133 $ $ $ $ $ Supplemental Disclosures: Cash paid for income taxes Cash paid for interest, net of interest capitalized Non-cash capital expenditures 3,220 1,112 136 3,774 1.035 248 4,732 991 1 150 Lowe's Companies, Inc. Consolidated Statements of Earnings (In millions, except per share and percentage data) January 31, 2020 February 2, 2018 Amount % Sales Amount % Sales 100.00% Fiscal Years Ended February 1, 2019 Amount 71,309 48,401 22,908 % Sales 100.00% S S 100.00% S. 72,148 49,205 22,943 68.20 67.88 68.619 46,185 22,434 67.31 31.80 32.12 32.69 24.41 21.04 Current Earnings Net sales Cost of sales Gross margin Expenses: Selling, general and administrative Depreciation and amortization Operating income Interest - net Loss on extinguishment of debt Pre-tax earnings Income tax provision Net earnings 21.30 1.75 8.75 2.07 15,367 1,262 6,314 691 2.05 17,413 1,477 4,018 624 5.64 9.60 0.96 0.88 0.92 14.444 1.404 6,586 633 464 5,489 2.042 3,447 0.68 8.00 5.623 4.76 7.79 1.86 5.93% 3.394 1.080 1.52 1.342 4.281 2.98 S S 2,314 3.24% S 5.02% S 5.49 S 2.84 S 4.09 Basic earnings per common share Diluted earnings per common share Cash dividends per share $ S 2.84 S 4.09 5.49 2.13 S $ 1.85 S 1.58 Lowe's Companies, Inc. Consolidated Statements of Comprehensive Income (In millions, except percentage data) January 31, 2020 Fiscal Years Ended February 1, 2019 Amount February 2, 2018 Amount % Sales % Sales Amount % Sales S 4,281 5.93 % $ 2,314 S 3.24 % (0.30) 3,447 251 5.02% 0.37 94 0.13 (221) (0.03 1 Net earnings Foreign currency translation adjustments - net of tax Other Other comprehensive income/(loss) Comprehensive income See accomnaming notes to consolidated financial statements (21) 73 0.10 (220) 0.37 (0.30) 2.94 % 251 3,698 4.354 6.03 % S 2,094 $ 5.39% 716 $ 511 218 Assets Current assets: Cash and cash equivalents Short-term investments Merchandise inventory - net Other current assets Total current assets Property, less accumulated depreciation Operating lease right-of-use assets Long-term investments Deferred income taxes - net Goodwill 160 13,179 1,263 15,318 18,669 3,891 372 216 12,561 938 14.228 18,432 256 294 303 303 Other assets 702 995 Total assets 39,471 34.508 1.941 722 1,110 8.279 Liabilities and shareholders' equity Current liabilities: Short-term borrowings Current maturities of long-term debt Current operating lease liabilities Accounts payable Accrued compensation and employee benefits Deferred revenue Other current liabilities Total current liabilities Long-term debt, excluding current maturities Noncurrent operating lease liabilities Deferred revenue - extended protection plans Other liabilities Total liabilities 597 501 7.659 684 1.219 2.581 662 1.299 15,182 16,768 3.943 2.425 14,497 14.391 894 827 712 37,499 1.149 30.864 Commitments and contingencies Shareholders' equity: Preferred stock - $5 par valve, none issued Common stock - $0.50 par value; Shares issued and outstanding January 31, 2020 February 1, 2019 Capital in excess of par value Retained earnings Accumulated other comprehensive loss Total shareholders' equity Total liabilities and shareholders' equity 763 801 381 401 1.727 (136) 1,972 39,471 3,452 (209) 3,644 34,508 S Lowe's Companies, Inc. Consolidated Statements of Shareholders' Equity (In millions, except per share data) Common Stock Capital in Excess of Par Value Total Shareholders' Equity Shares Amount Accumulated Other Comprehensive Income/(Loss) (240) 866 S 433 S Retained Earnings 6.241 3,447 S s S 6,434 251 3,447 251 (1,324) 99 (1.324 99 (215) 401 (20) (2.939) 4 138 830 s 415 S 22 s s 11 S 5,425 33 2,314 (220) (1,500 Balance February 3, 2017 Net earnings Other comprehensive income Cash dividends declared, $1.58 per share Share-based payment expense Repurchase of common stock Issuance of common stock under share-based payment plans Balance February 2, 2018 Cumulative effect of accounting change Net earnings Other comprehensive loss Cash dividends declared, $1.85 per share Share-based payment expense Repurchase of common stock Issuance of common stock under share-based payment plans Balance February 1, 2019 Cumulative effect of accounting change Net earnings Other comprehensive income Cash dividends declared, $2.13 per share Share-based payment expense Repurchase of common stock Issuance of common stock under share-based payment plans Balance January 31, 2020 See accompanying notes to consolidated financial statements. FI (32) (16) (209 (2.820) 113 (3.174 140 5,873 33 2.314 (220) (1,500) 74 3,045) 115 3,644 (263) 4,281 73 (1.653) 98 (4,325) 117 1,972 801 S 401 S S S (209) S 3,452 (263) 4.281 73 (1,653) 98 (41) (21) (214) (4,090) 116 763 S 381 S S 1,727 S (136) $ 4.281 S 2.314 $ 3.447 1.410 1.60 1,540 468 (151) Cash flows from operating activities: Net earnings Adjustments to reconcile net earnings to net cash provided by operating activities: Depreciation and amortization Noncash lease expense Deferred income taxes Loss on property and other assets - net Impairment of goodwill Loss on extinguishment of debt Loss (gain) on cost method and equity method investments Share-based payment expense Changes in operating assets and liabilities: Merchandise inventory - net Other operating assets Accounts payable Other operating liabilities Net cash provided by operating activities 74 (600) (376) (637) (654) 4.296 (1,289) (110) 1,720 437 6,193 13 5,065 (1,373) 1,393 (981 1,114 Cash flows from investing activities: Purchases of investments Proceeds from sale maturity of investments Capital expenditures Proceeds from sale of property and other long-term assets Acquisition of business - net (743) 693 (1,484) 163 (1,174) (1.123) 76 45 Other - net (509) 13 (1,441) Net cash used in investing activities (1,369) (1,080) (415) 625 2.968 Cash flows from financing activities: Net change in commercial paper Net proceeds from issuance of debt Repayment of long-term debt Proceeds from issuance of common stock under share-based payment plans Cash dividend payments Repurchase of common stock Other - net Net cash used in financing activities 220 3,972 (1,113) 118 (1.618) (4,313) (1) (2,735) (326) 114 (1,455) (3.037 (2,849 139 (1.288 (3,192) (10) (3,607 (5,124) (12) 13 193 (23) Effect of exchange rate changes on cash Net increase (decrease) in cash and cash equivalents, including cash classified within current assets held for sale Less: Net increase (decrease) in cash classified within current assets held for sale Net increase (decrease) in cash and cash equivalents Cash and cash equivalents, beginning of year Cash and cash equivalents, end of year 588 716 511 Seeman atas talidated financial statemente