Answered step by step
Verified Expert Solution
Question
1 Approved Answer
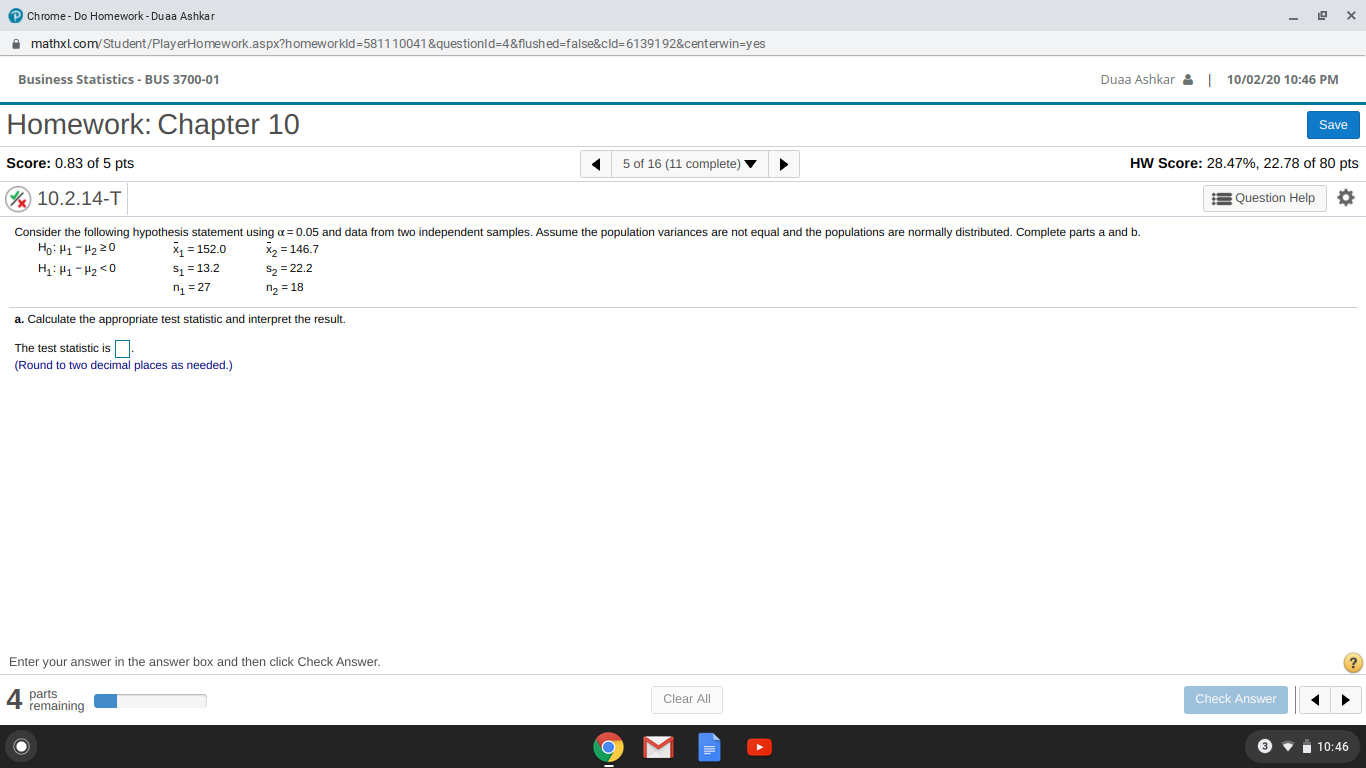
a. Calculate the appropriate test statistic and interpret the result. The test statistic is? b. The critical?value(s) is(are)? c. Because the test statistic is not
a. Calculate the appropriate test statistic and interpret the result.
The test statistic is?
b.The critical?value(s) is(are)?
c. Because the test statistic is not less than the critical value/does not fall within the critical values, do not reject/reject the null hypothesis.
d. The?p-value is?
e. Interpret the result. Choose the correct answer be
Step by Step Solution
There are 3 Steps involved in it
Step: 1

Get Instant Access to Expert-Tailored Solutions
See step-by-step solutions with expert insights and AI powered tools for academic success
Step: 2

Step: 3

Ace Your Homework with AI
Get the answers you need in no time with our AI-driven, step-by-step assistance
Get Started


