

Question
A calculated data table is present.A calculated data table is clearly labeled, organized, and readable.The calculated data table includes all the calculated values necessary to
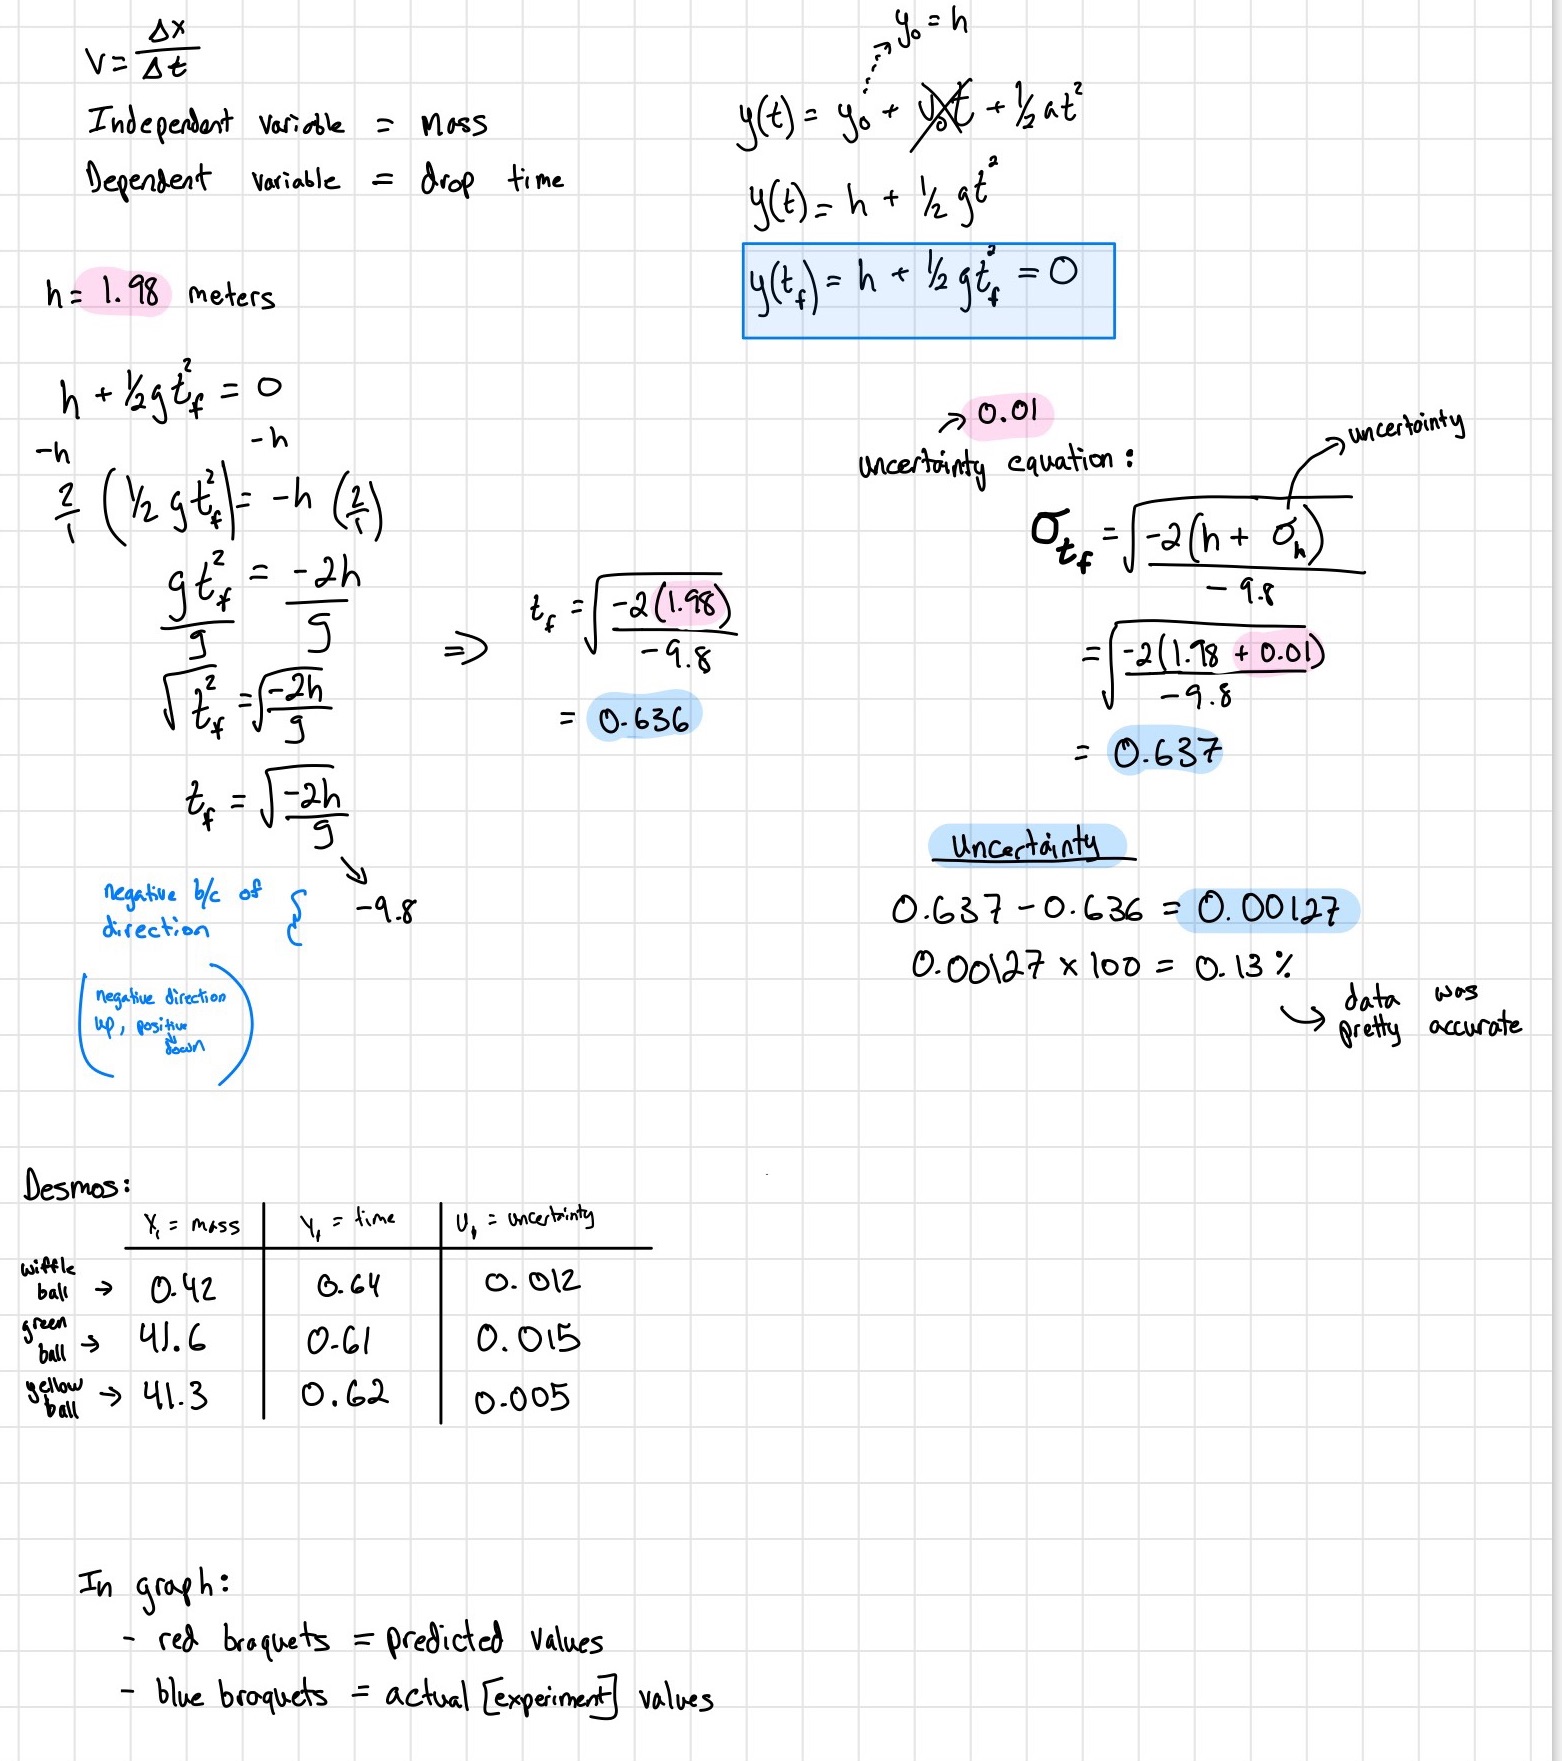
A calculated data table is present.A calculated data table is clearly labeled, organized, and readable.The calculated data table includes all the calculated values necessary to answer the experimental question.Each calculated value includes appropriate units. These units may be in a column or row header.Each calculated value is physically reasonable.For each type of calculation, an example is shown.Each example calculation includes an algebraic formula without any values plugged in.Each example calculation shows a numerical formula with example values plugged in.Each example calculation shows the correct units used in the numerical formula.calculated values have the greatest uncertainties (either standard deviations or error propagation).The plot shows average values for different sets of trials, rather than a data point for each trial.|The axes are labeled appropriately, with correct units and s..t@.There are error bars on each data point.The error bars on observed values show the total uncertainty.A short caption explains what the plot showsThe axes relate to the experimental question. "Trial" or "trial number" is not one of the axes.Each measurement shown on the plot is physically reasonable
Step by Step Solution
There are 3 Steps involved in it
Step: 1

Get Instant Access to Expert-Tailored Solutions
See step-by-step solutions with expert insights and AI powered tools for academic success
Step: 2

Step: 3
Ace Your Homework with AI
Get the answers you need in no time with our AI-driven, step-by-step assistance
Get Started
Thermal Physics
Authors: Charles Kittel, Herbert Kroem
2nd Edition
716710889, 978-0716710882