Question
A calibration curve for the colorimetric determination of phosphorous in urine is prepared by reacting standard solutions of phosphate with molybdenum (VI) and reducing the
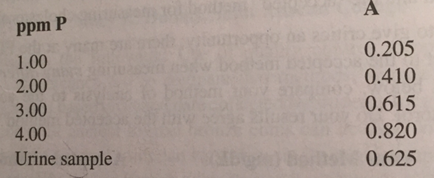
A calibration curve for the colorimetric determination of phosphorous in urine is prepared by reacting standard solutions of phosphate with molybdenum (VI) and reducing the phosphor-molybdic acid complex to produce the characteristic blue color. The measured absorbance A is plotted against the concentration of phosphorous. From the following data, determine the linear least-squares line and calculate the phosphorous concentration in the urine sample:

ppm P 1.00 2.00 3.00 4.00 Urine sample A 0.205 0.410 0.615 0.820 tel 0.625
Step by Step Solution
3.40 Rating (153 Votes )
There are 3 Steps involved in it
Step: 1
x 100 200 300 400 y 0205 0410 0615 0820 Mean of x u 100 200 ...
Get Instant Access to Expert-Tailored Solutions
See step-by-step solutions with expert insights and AI powered tools for academic success
Step: 2

Step: 3

Ace Your Homework with AI
Get the answers you need in no time with our AI-driven, step-by-step assistance
Get StartedRecommended Textbook for
Design And Analysis Of Experiments
Authors: Douglas C., Montgomery
5th Edition
978-0471316497, 0471316490
Students also viewed these Chemistry questions
Question
Answered: 1 week ago
Question
Answered: 1 week ago
Question
Answered: 1 week ago
Question
Answered: 1 week ago
Question
Answered: 1 week ago
Question
Answered: 1 week ago
Question
Answered: 1 week ago
Question
Answered: 1 week ago
Question
Answered: 1 week ago
Question
Answered: 1 week ago
Question
Answered: 1 week ago
Question
Answered: 1 week ago
Question
Answered: 1 week ago
Question
Answered: 1 week ago
Question
Answered: 1 week ago
Question
Answered: 1 week ago
Question
Answered: 1 week ago
Question
Answered: 1 week ago
Question
Answered: 1 week ago
Question
Answered: 1 week ago
View Answer in SolutionInn App


