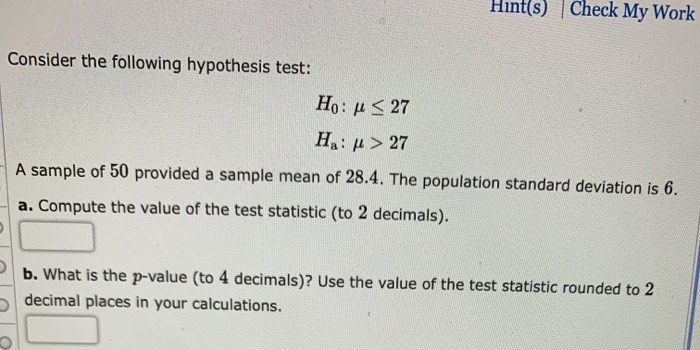
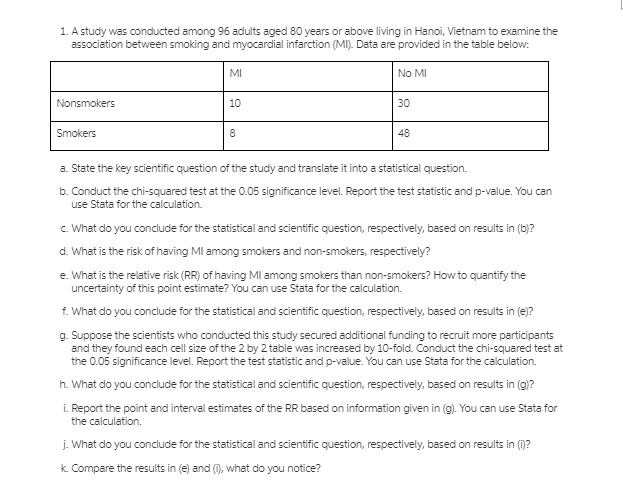
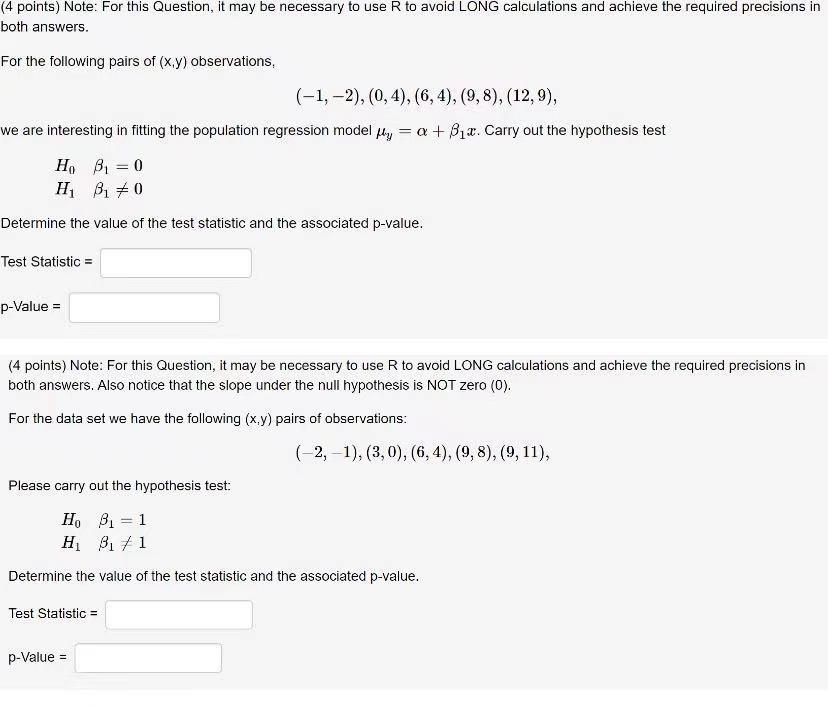
Answered step by step
Verified Expert Solution
Link Copied!

Question

1 Approved Answer

A certain country has four regions: North, East, South, and West. The populations of these regions are 3 million, 4 million, 5 million, and 8

A certain country has four regions: North, East, South, and West. The populations of

these regions are 3 million, 4 million, 5 million, and 8 million, respectively. There are 4

cities in the North, 3 in the East, 2 in the South, and there is only 1 city in the West.

Each person in the country lives in exactly one of these cities.

(a) What is the average size of a city in the country? (This is the arithmetic mean of

the populations of the cities, and is also the expected value of the population of a city

chosen uniformly at random.)

Hint: Give the cities names (labels).

(b) Show that without further information it is impossible to find the variance of the

population of a city chosen uniformly at random. That is, the variance depends on how

the people within each region are allocated between the cities in that region.

(c) A region of the country is chosen uniformly at random, and then a city within that

region is chosen uniformly at random. What is the expected population size of this

randomly chosen city?

Hint: To help organize the calculation, start by finding the PMF of the population size

of the city.

(d) Explain intuitively why the answer to (c) is larger than the answer to .

A hacker is trying to break into a password-protected website by randomly trying to

guess the password. Let m be the number of possible passwords.

(a) Suppose for this part that the hacker makes random guesses (with equal probability),

with replacement. Find the average number of guesses it will take until the hacker guesses

the correct password (including the successful guess).

(b) Now suppose that the hacker guesses randomly, without replacement. Find the average number of guesses it will take until the hacker guesses the correct password (including

the successful guess).

Hint: Use symmetry to find the PMF of the number of guesses.

image text in transcribedimage text in transcribedimage text in transcribed
Hint(s) | Check My Work Consider the following hypothesis test: Ho: us 27 Ha: H > 27 A sample of 50 provided a sample mean of 28.4. The population standard deviation is 6. a. Compute the value of the test statistic (to 2 decimals). b. What is the p-value (to 4 decimals)? Use the value of the test statistic rounded to 2 decimal places in your calculations.1. A study was conducted among 96 adults aged 80 years or above living in Hanoi, Vietnam to examine the association between smoking and myocardial infarction (MI). Data are provided in the table below: MI No MI Nonsmokers 10 30 Smokers 8 48 a. State the key scientific question of the study and translate it into a statistical question. b. Conduct the chi-squared test at the 0.05 significance level. Report the test statistic and p-value. You can use Stata for the calculation. c. What do you conclude for the statistical and scientific question, respectively, based on results in (b)? d. What is the risk of having MI among smokers and non-smokers, respectively? e. What is the relative rick (RR) of having MI among smokers than non-smokers? How to quantify the uncertainty of this point estimate? You can use Stata for the calculation. f. What do you conclude for the statistical and scientific question, respectively, based on results in (e)? g. Suppose the scientists who conducted this study secured additional funding to recruit more participants and they found each cell size of the 2 by 2 table was increased by 10-fold. Conduct the chi-squared test at the 0.05 significance level. Report the test statistic and p-value. You can use Stata for the calculation. h. What do you conclude for the statistical and scientific question, respectively, based on results in (g)? i. Report the point and interval estimates of the RR based on information given in (9). You can use Stata for the calculation. j. What do you conclude for the statistical and scientific question, respectively, based on results in ()? k. Compare the results in (e) and (), what do you notice?(4 points] Note: For this Question, It may be necessary to use R to avoid LONG calculations and achieve the required precisions in both answers. For the following pairs of {my} observations. [112)1(3 4)! (t 4}: (gs 3'): [1219}: we are interesting in tting the population regression model \"y = o + 313. Carry out the hypothesis test Ho i31=\":I H1 51%\" Detennine the value (3f thE_tESt statistic and the associated p-ualue. Test Statistic = p-Value = {4 points) Note: Forthis Question, it may be necessary to use R to avoid LUNG calculations and achieve the required precisicns in both answers. Also notice that the slope under the null hypothesis is NOT zero {0}. For the data set we have the following (my) pairs of observations: (21_1}1{39011{Er 4],{918),[QJI]}, Piease SEW out the hypothesis test: Ho 131:1 H1 31%]- Determine the value of the test statistic and the associated pvalue. Test Statistic = ptfalue =

Step by Step Solution

There are 3 Steps involved in it

Step: 1

blur-text-image

Get Instant Access to Expert-Tailored Solutions

See step-by-step solutions with expert insights and AI powered tools for academic success

Step: 2

blur-text-image

Step: 3

blur-text-image

Ace Your Homework with AI

Get the answers you need in no time with our AI-driven, step-by-step assistance

Get Started

Recommended Textbook for

Applied Calculus

Authors: Stefan Waner, Steven Costenoble

7th Edition

1337514306, 9781337514309

More Books

Students also viewed these Mathematics questions