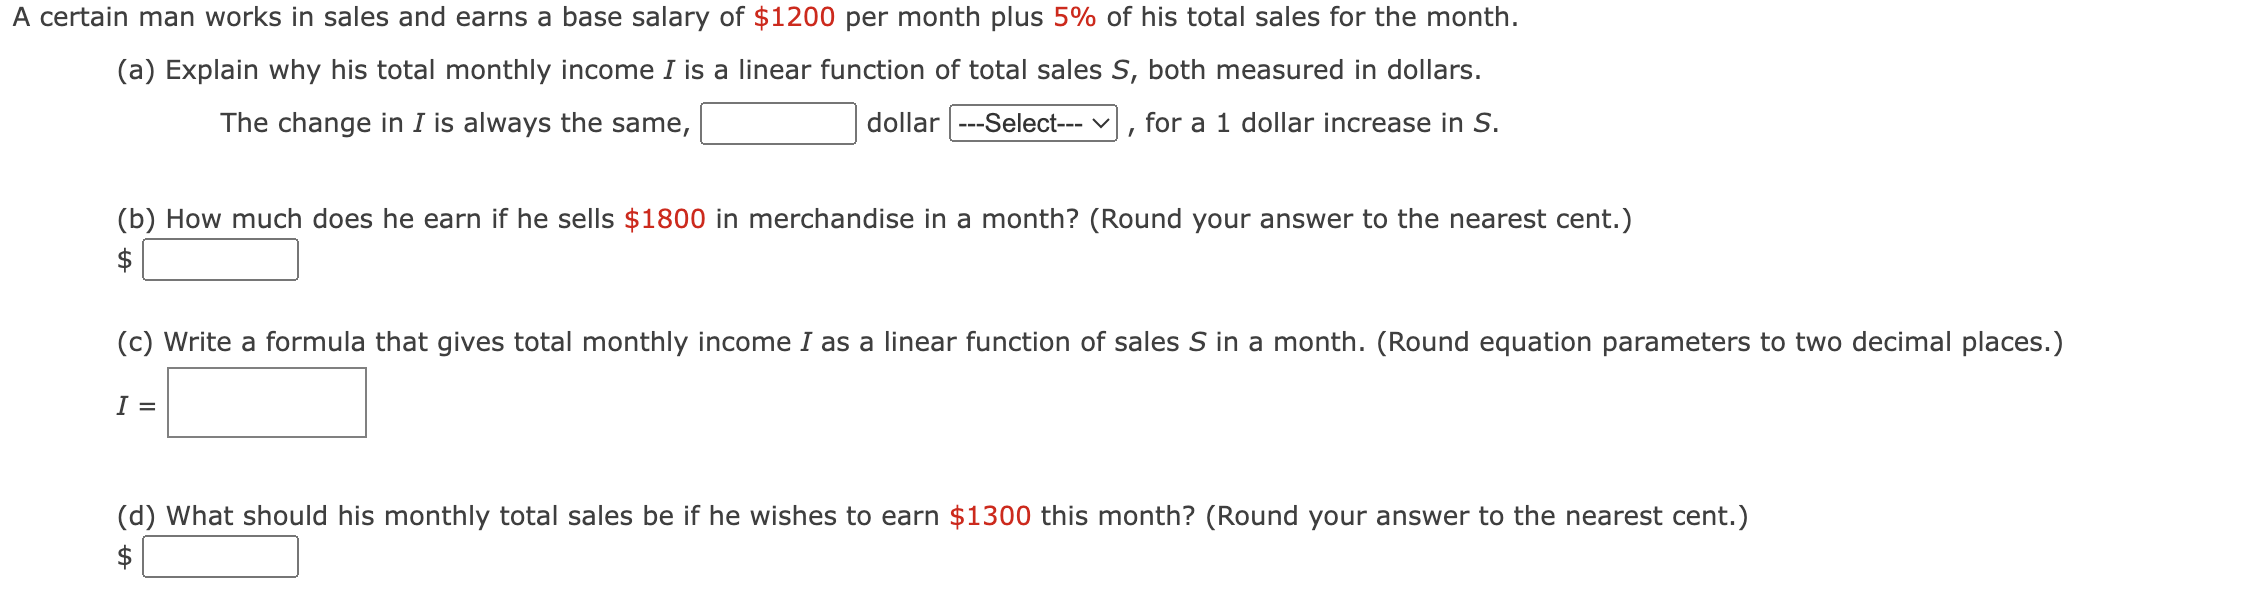
A certain man works in sales and earns a base salary of $1200 per month plus 5% of his total sales for the month. (a)
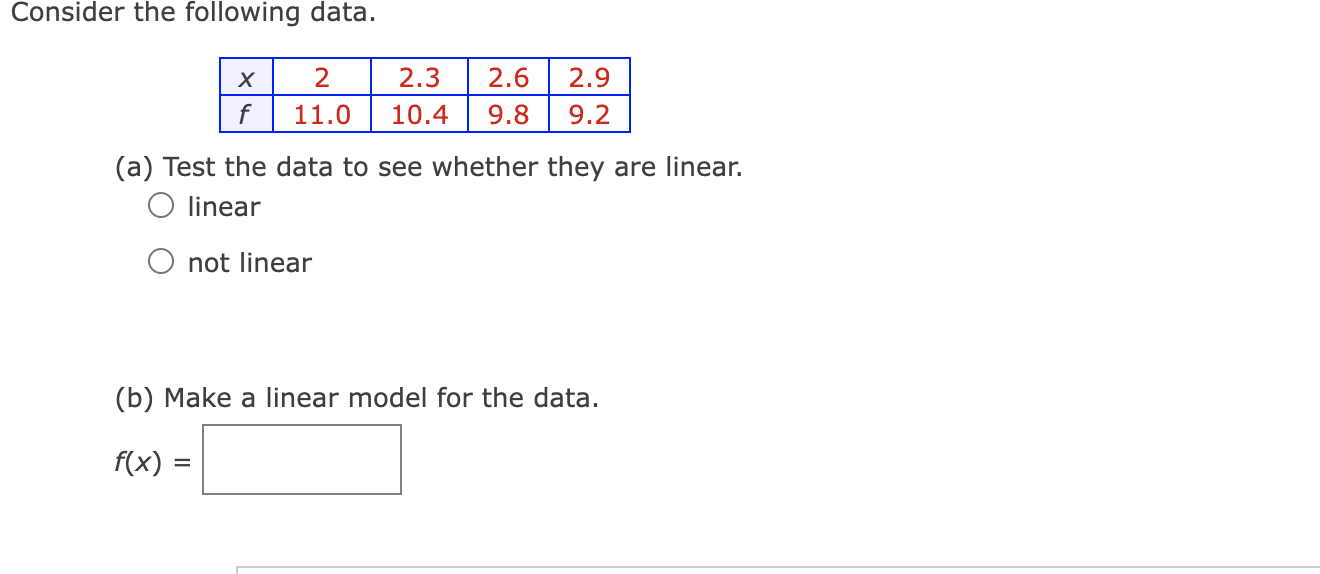
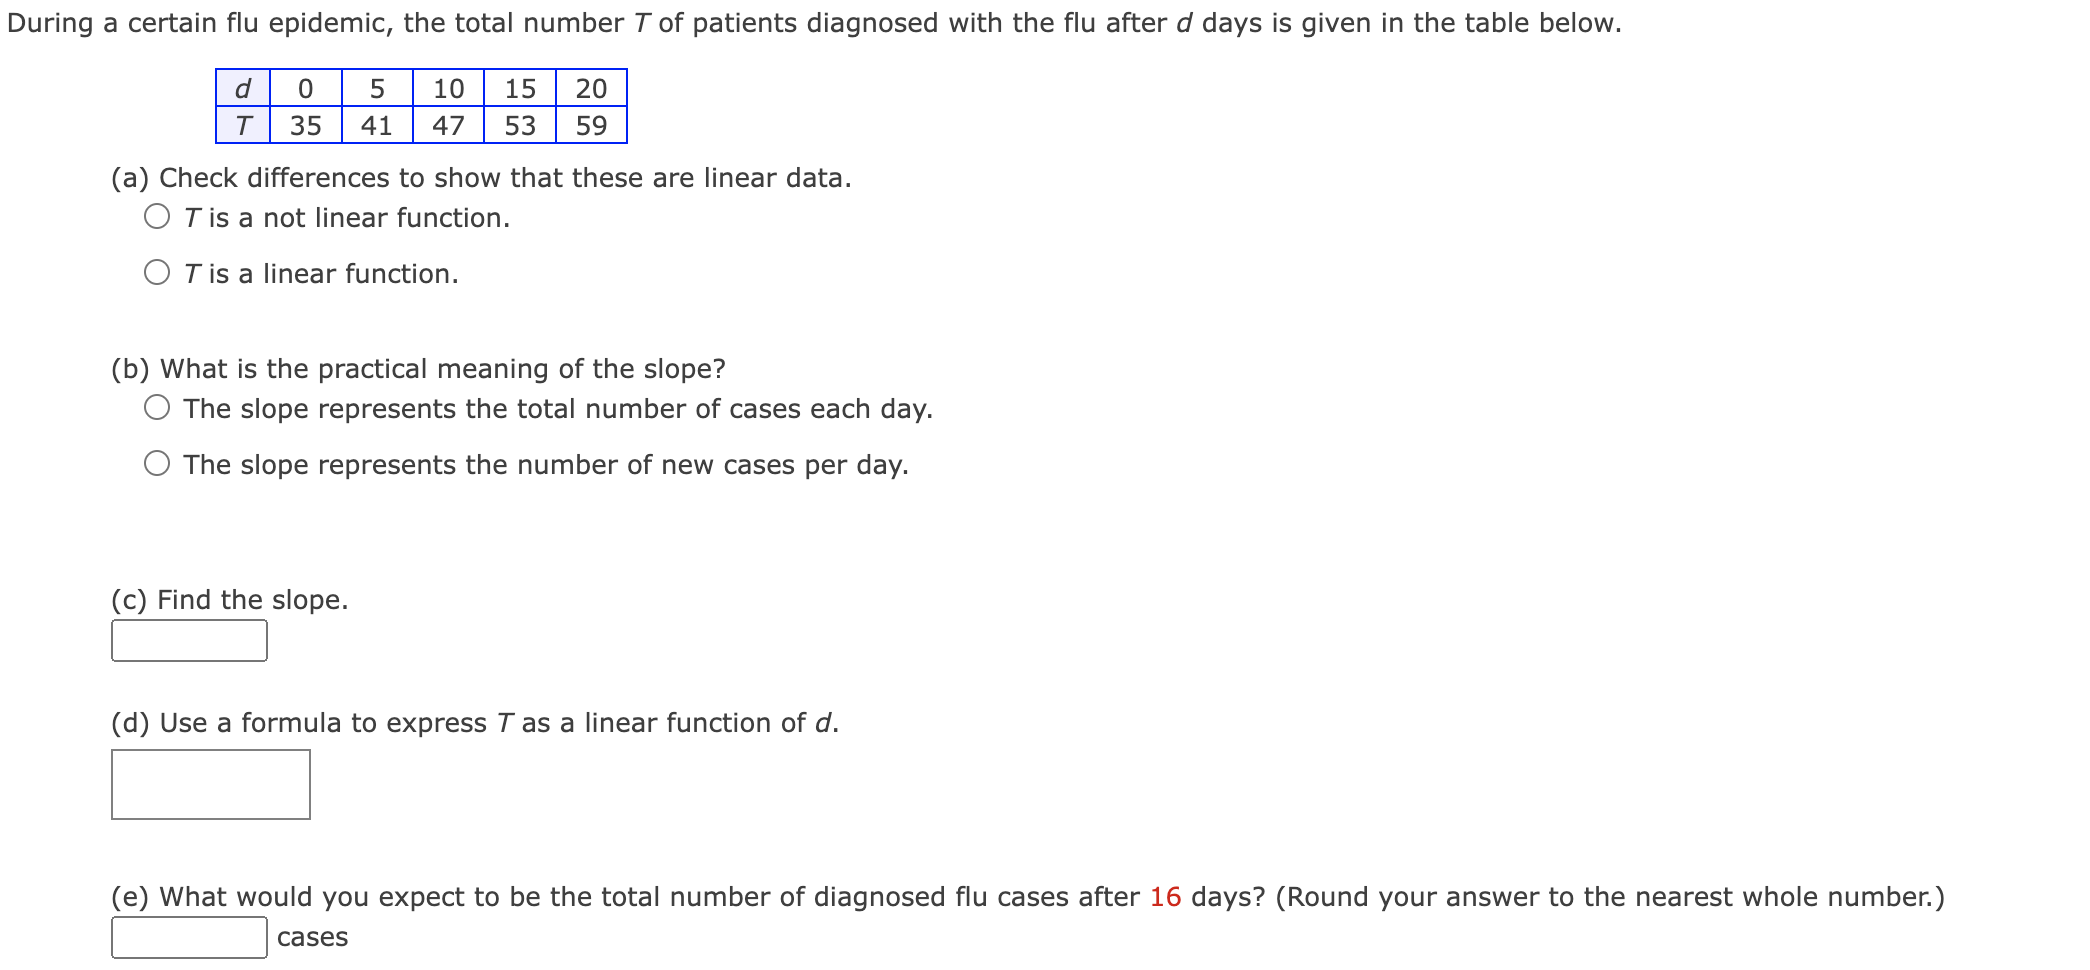
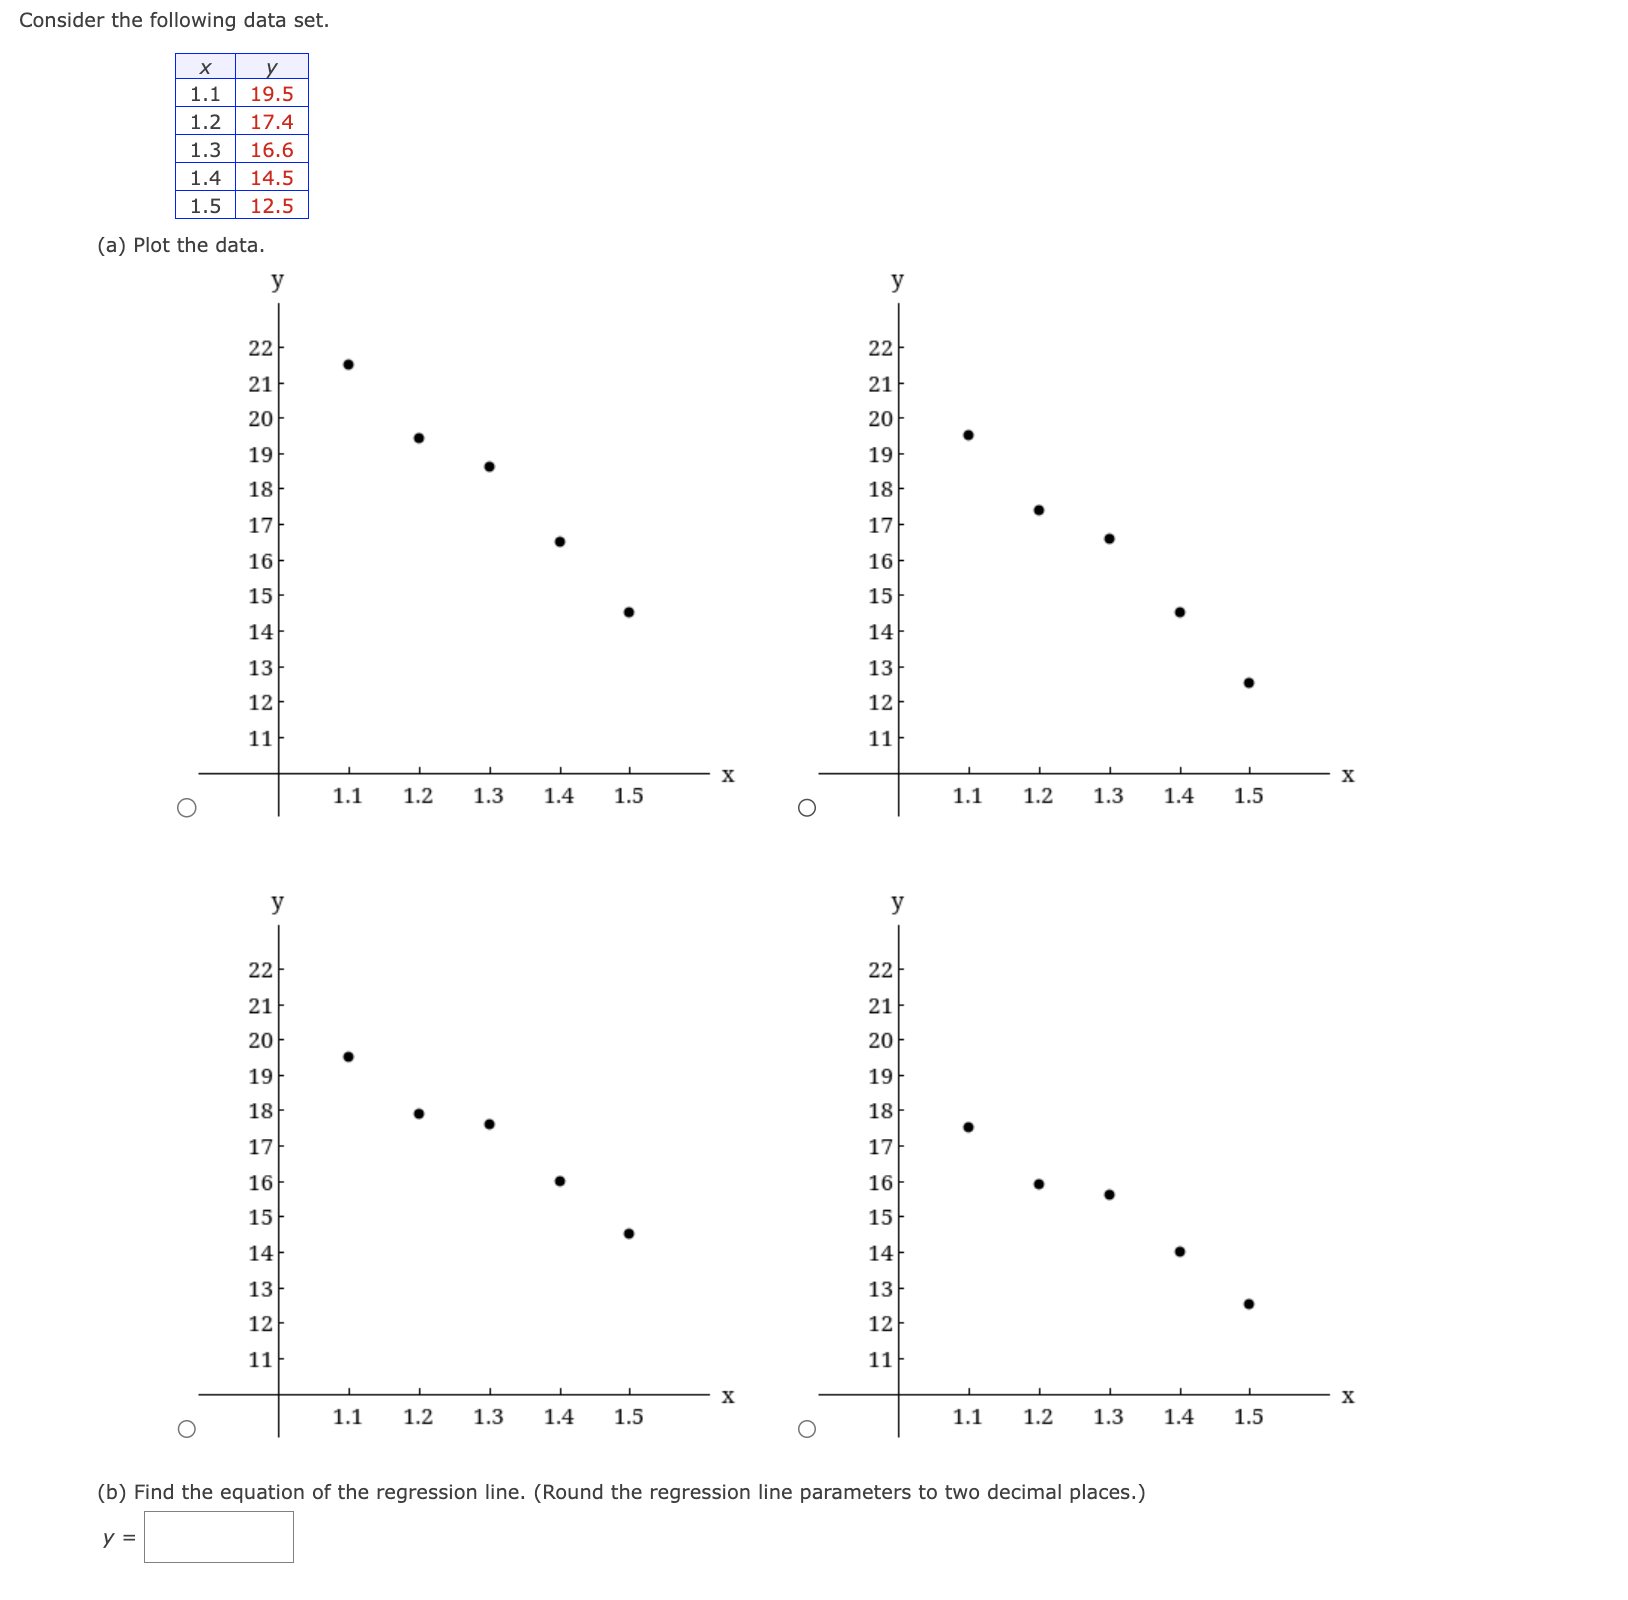
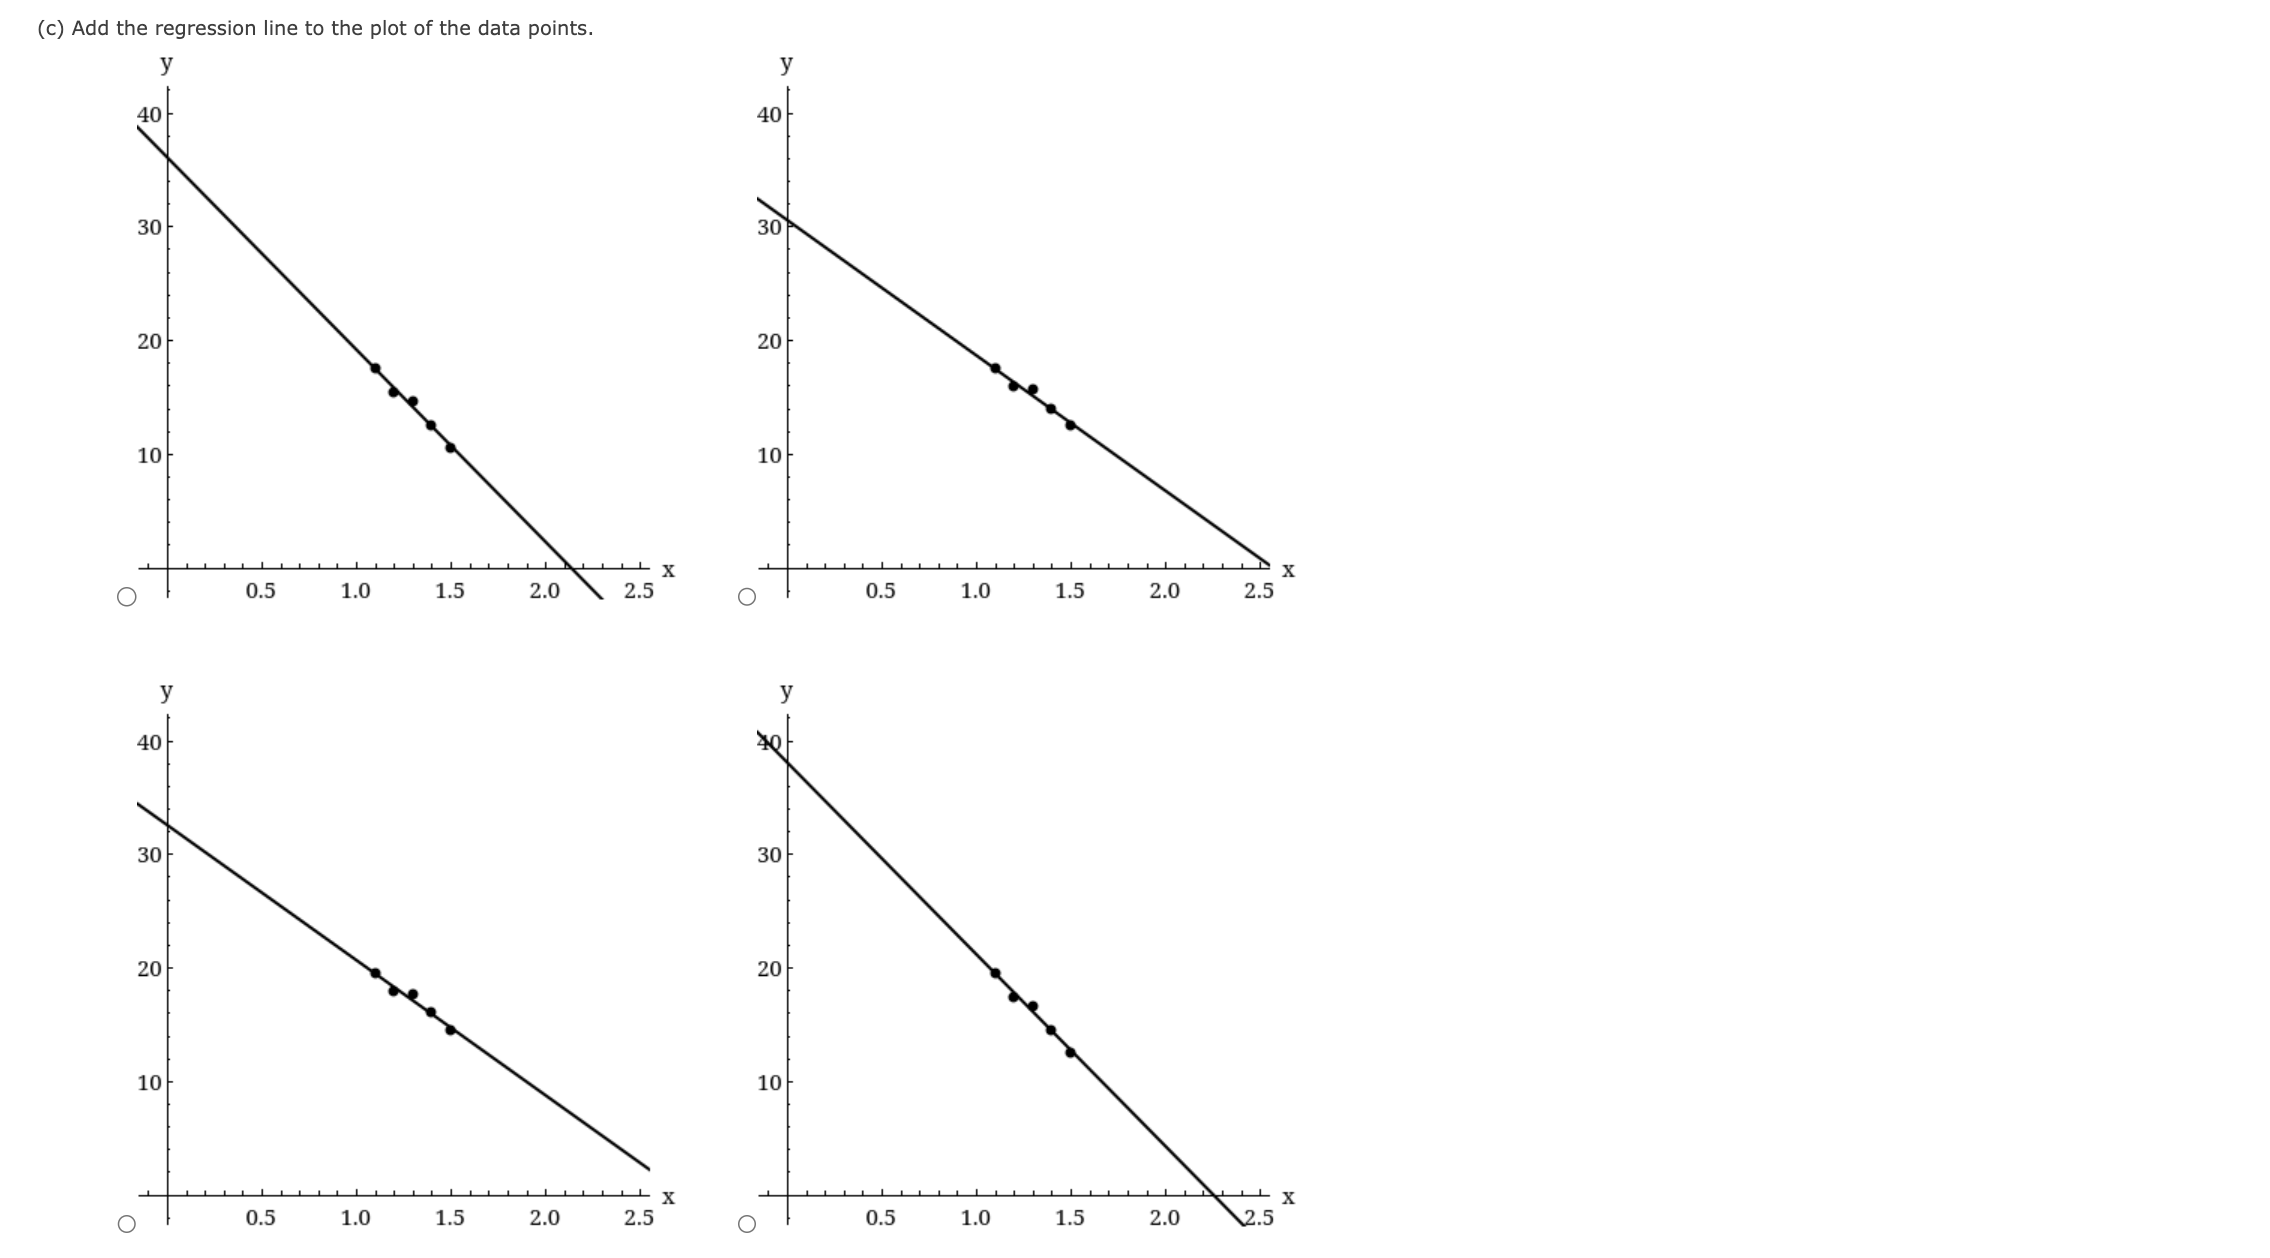
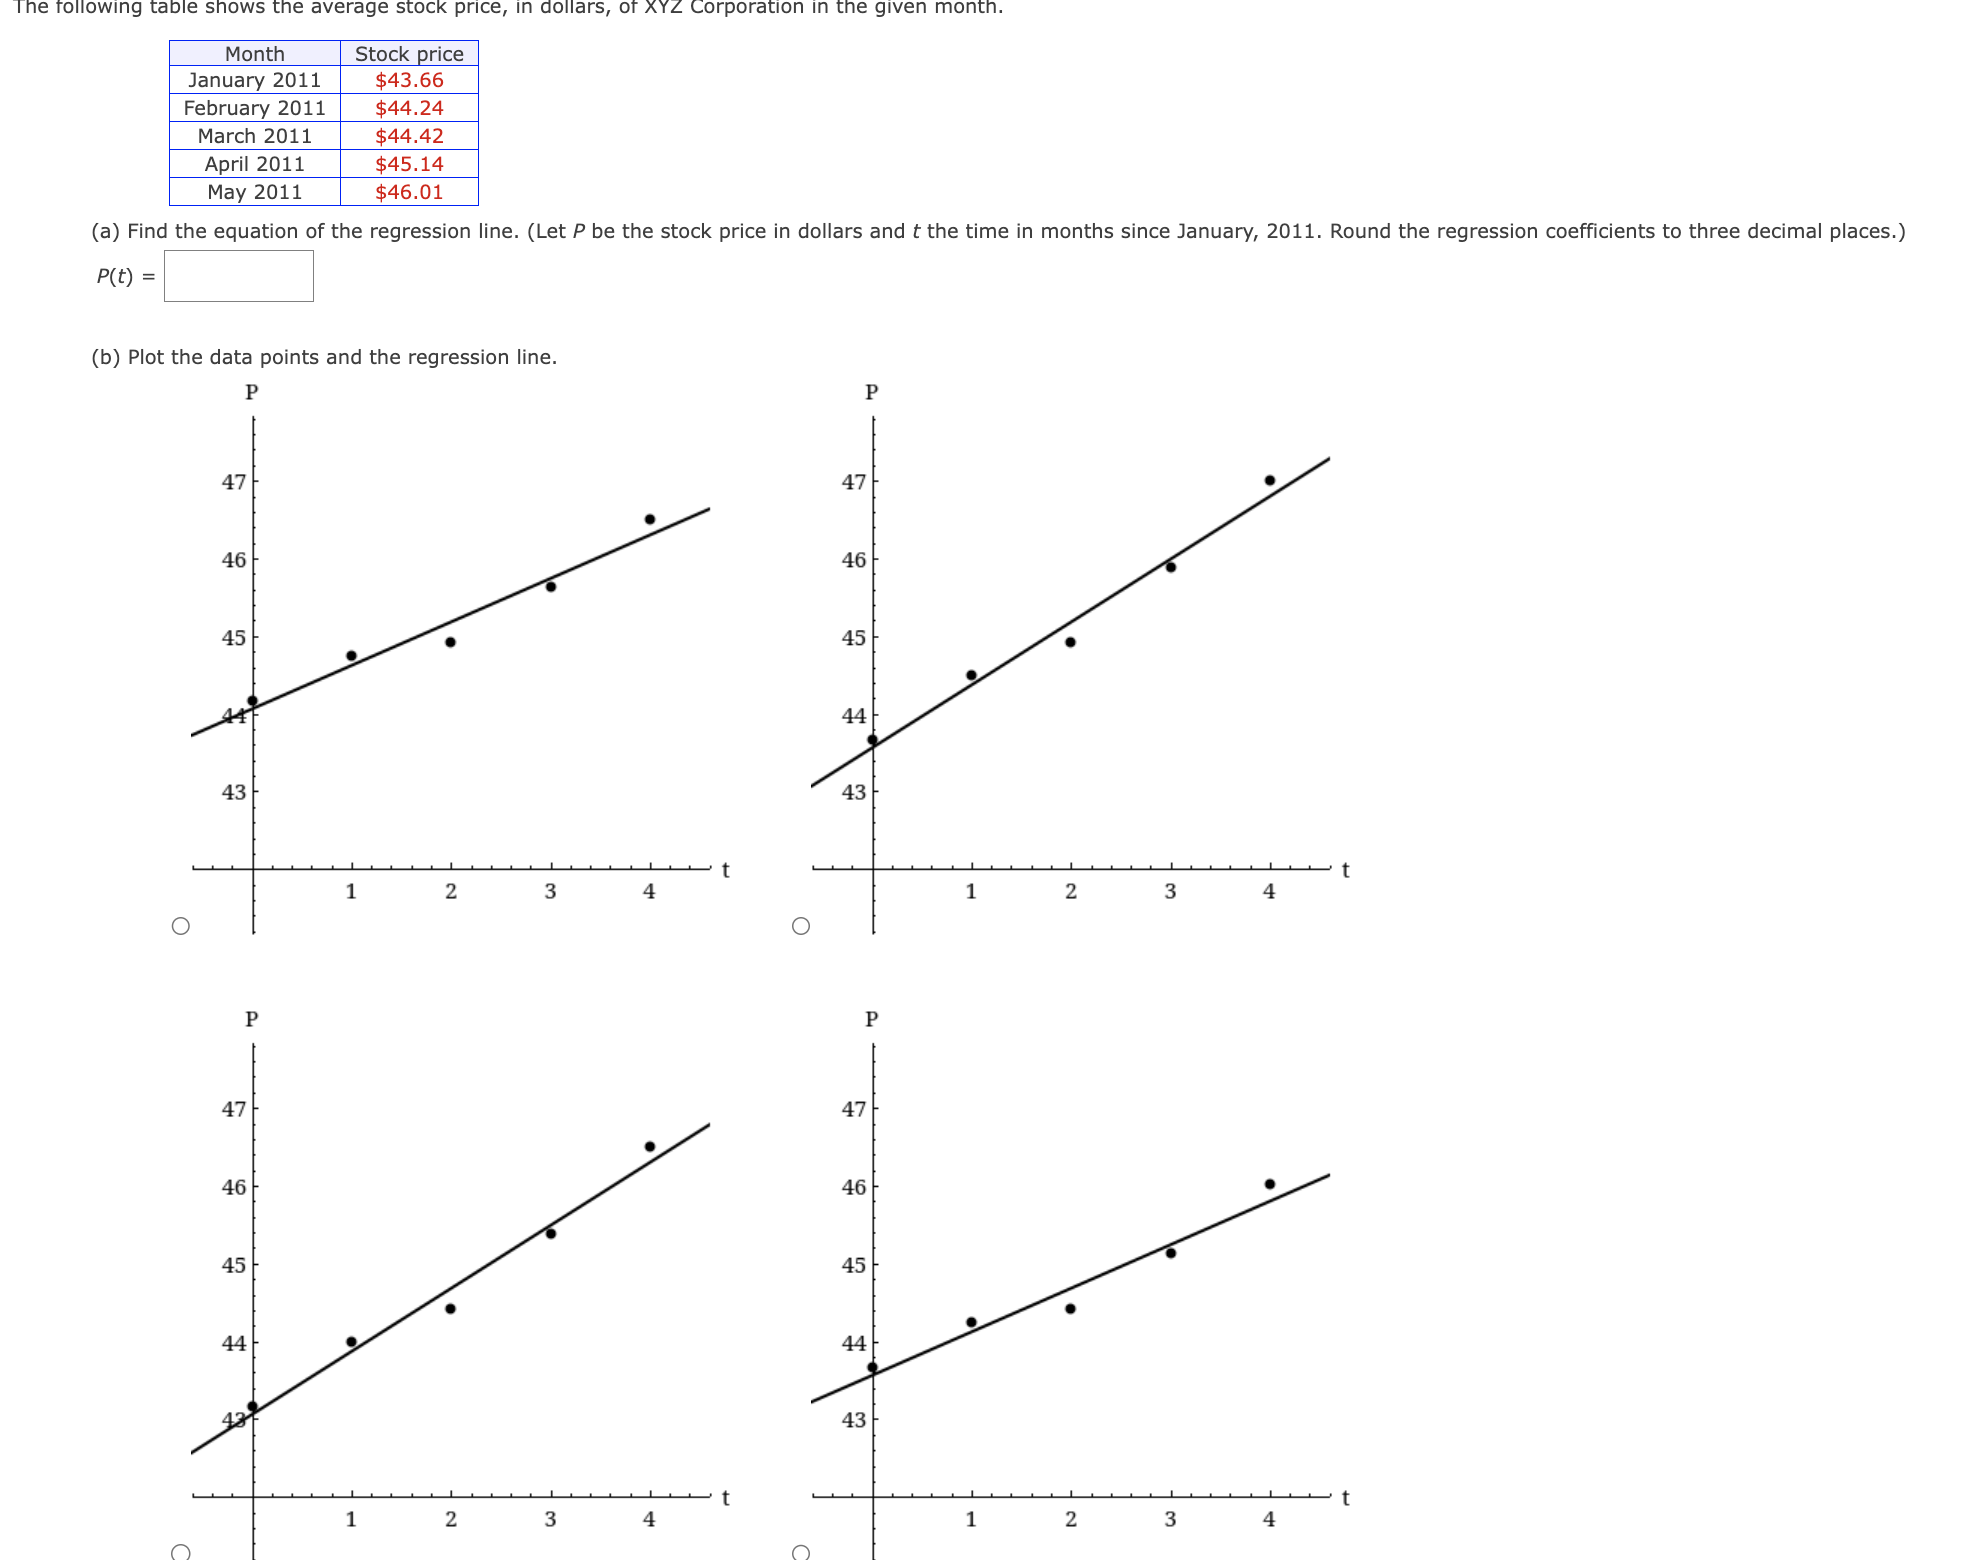
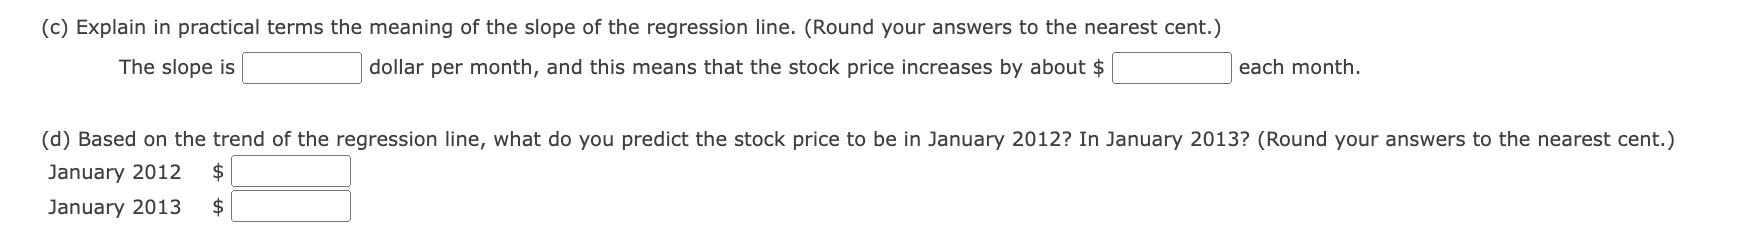
A certain man works in sales and earns a base salary of $1200 per month plus 5% of his total sales for the month. (a) Explain why his total monthly income I is a linear function of total sales S, both measured in dollars. The change in I is always the same, dollar ---Select--- v , for a 1 dollar increase in S. (b) How much does he earn if he sells $1800 in merchandise in a month? (Round your answer to the nearest cent.) $ (c) Write a formula that gives total monthly income I as a linear function of sales S in a month. (Round equation parameters to two decimal places.) I= (d) What should his monthly total sales be if he wishes to earn $1300 this month? (Round your answer to the nearest cent.) $ Consider the following data. | f[11.0[104]98]9.2 (a) Test the data to see whether they are linear. O linear O not linear (b) Make a linear model for the data. During a certain flu epidemic, the total number T of patients diagnosed with the flu after d days is given in the table below. d| 0 5 10|15 ] 20 T |35 |41 ]47 [53]59 (a) Check differences to show that these are linear data. O T is a not linear function. O Tis a linear function. (b) What is the practical meaning of the slope? O The slope represents the total number of cases each day. O The slope represents the number of new cases per day. (c) Find the slope. (d) Use a formula to express T as a linear function of d. (e) What would you expect to be the total number of diagnosed flu cases after 16 days? (Round your answer to the nearest whole number.) cases Consider the following data set. X y 1.1 19.5 1.2 17.4 1.3 16.6 1.4 1.5 12.5 (a) Plot the data 22 22 21 21 20 20 19 19 18 18 17 17 16 16 15 15 14 14 13 13 12 12 11 11 X O 1.2 1.3 1.4 1.5 X O 1.1 1.2 1.3 1.4 1.5 22 22 21 21 20 20 19 19 18 18 17 17 16 16 15 15 14 14 13 13 12 12 11 11 1.1 - X 1.2 1.3 1.4 1.5 1.1 1.2 1 1.3 1.4 1.5 (b) Find the equation of the regression line. (Round the regression line parameters to two decimal places.) y =(c) Add the regression line to the plot of the data points. y 40 40 The following table shows the average stock price, in dollars, of XYZ Corporation in the given month. (@) Find the equation of t P(t) = Month Stock price January 2011 $43.66 February 2011 $44.24 March 2011 $44.42 April 2011 $45.14 May 2011 $46.01 he regression ine. (Let P be the stock price in dollars and t the time in months since January, 2011. Round the regression coefficients to three decimal places.) (b) Plot the data points and the regression line. P (c) Explain in practical terms the meaning of the slope of the regression line. (Round your answers to the nearest cent.) The slope is :] dollar per month, and this means that the stock price increases by about $ S each month. (d) Based on the trend of the regression line, what do you predict the stock price to be in January 2012? In January 2013? (Round your answers to the nearest cent.) January 2012 $ S January 2013 $ :]
Step by Step Solution
There are 3 Steps involved in it
Step: 1
Get Instant Access to Expert-Tailored Solutions
See step-by-step solutions with expert insights and AI powered tools for academic success
Step: 2
Step: 3
Ace Your Homework with AI
Get the answers you need in no time with our AI-driven, step-by-step assistance