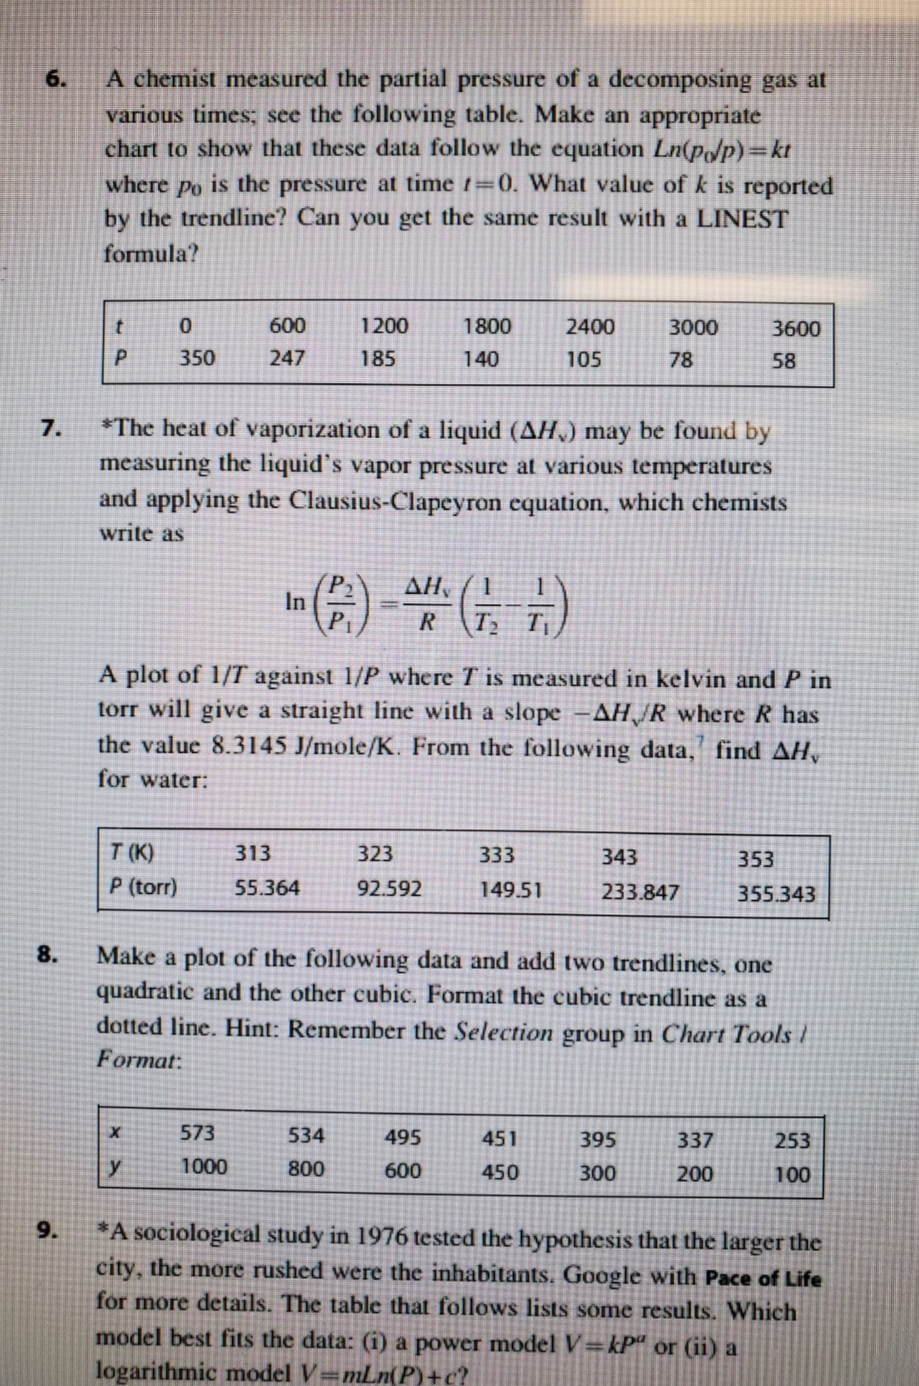
A chemist measured the partial pressure of a decomposing gas at various times; see the following table. Make an appropriate chart to show that these data follow the equation Ln(pdp)=kt where po is the pressure at time =0. What value of k is reported by the trendline? Can you get the same result with a LINEST formula? 1800 2400 3000 3600 600 247 1200 185 350 140 105 78 58 *The heat of vaporization of a liquid (AH) may be found by measuring the liquid's vapor pressure at various temperatures and applying the Clausius-Clapeyron equation, which chemists write as PR TT) A plot of 1/T against 1/P where I is measured in kelvin and P in torr will give a straight line with a slope -AH/R where R has the value 8.3145 J/mole/K. From the following data, find AH, for water: 333 T(K) P (torr) 313 55.364 323 92.592 343 233.847 353 355.343 149.51 Make a plot of the following data and add two trendlines, one quadratic and the other cubic. Format the cubic trendline as a dotted line. Hint: Remember the Selection group in Chart Tools / Format: 573 y 1000 534 800 495 600 451 450 395 300 337 200 253 100 *A sociological study in 1976 tested the hypothesis that the larger the city, the more rushed were the inhabitants. Google with Pace of Life for more details. The table that follows lists some results. Which model best fits the data: (i) a power model V=kp' or (ii) a logarithmic model V=mLn(P)+c? A chemist measured the partial pressure of a decomposing gas at various times; see the following table. Make an appropriate chart to show that these data follow the equation Ln(pdp)=kt where po is the pressure at time =0. What value of k is reported by the trendline? Can you get the same result with a LINEST formula? 1800 2400 3000 3600 600 247 1200 185 350 140 105 78 58 *The heat of vaporization of a liquid (AH) may be found by measuring the liquid's vapor pressure at various temperatures and applying the Clausius-Clapeyron equation, which chemists write as PR TT) A plot of 1/T against 1/P where I is measured in kelvin and P in torr will give a straight line with a slope -AH/R where R has the value 8.3145 J/mole/K. From the following data, find AH, for water: 333 T(K) P (torr) 313 55.364 323 92.592 343 233.847 353 355.343 149.51 Make a plot of the following data and add two trendlines, one quadratic and the other cubic. Format the cubic trendline as a dotted line. Hint: Remember the Selection group in Chart Tools / Format: 573 y 1000 534 800 495 600 451 450 395 300 337 200 253 100 *A sociological study in 1976 tested the hypothesis that the larger the city, the more rushed were the inhabitants. Google with Pace of Life for more details. The table that follows lists some results. Which model best fits the data: (i) a power model V=kp' or (ii) a logarithmic model V=mLn(P)+c


