

Answered step by step
Verified Expert Solution
Question
1 Approved Answer
a. Choose the correct graph below OA DB. 60- 80- 0 0 The following table compares fuel economy as calculated by car owners and by
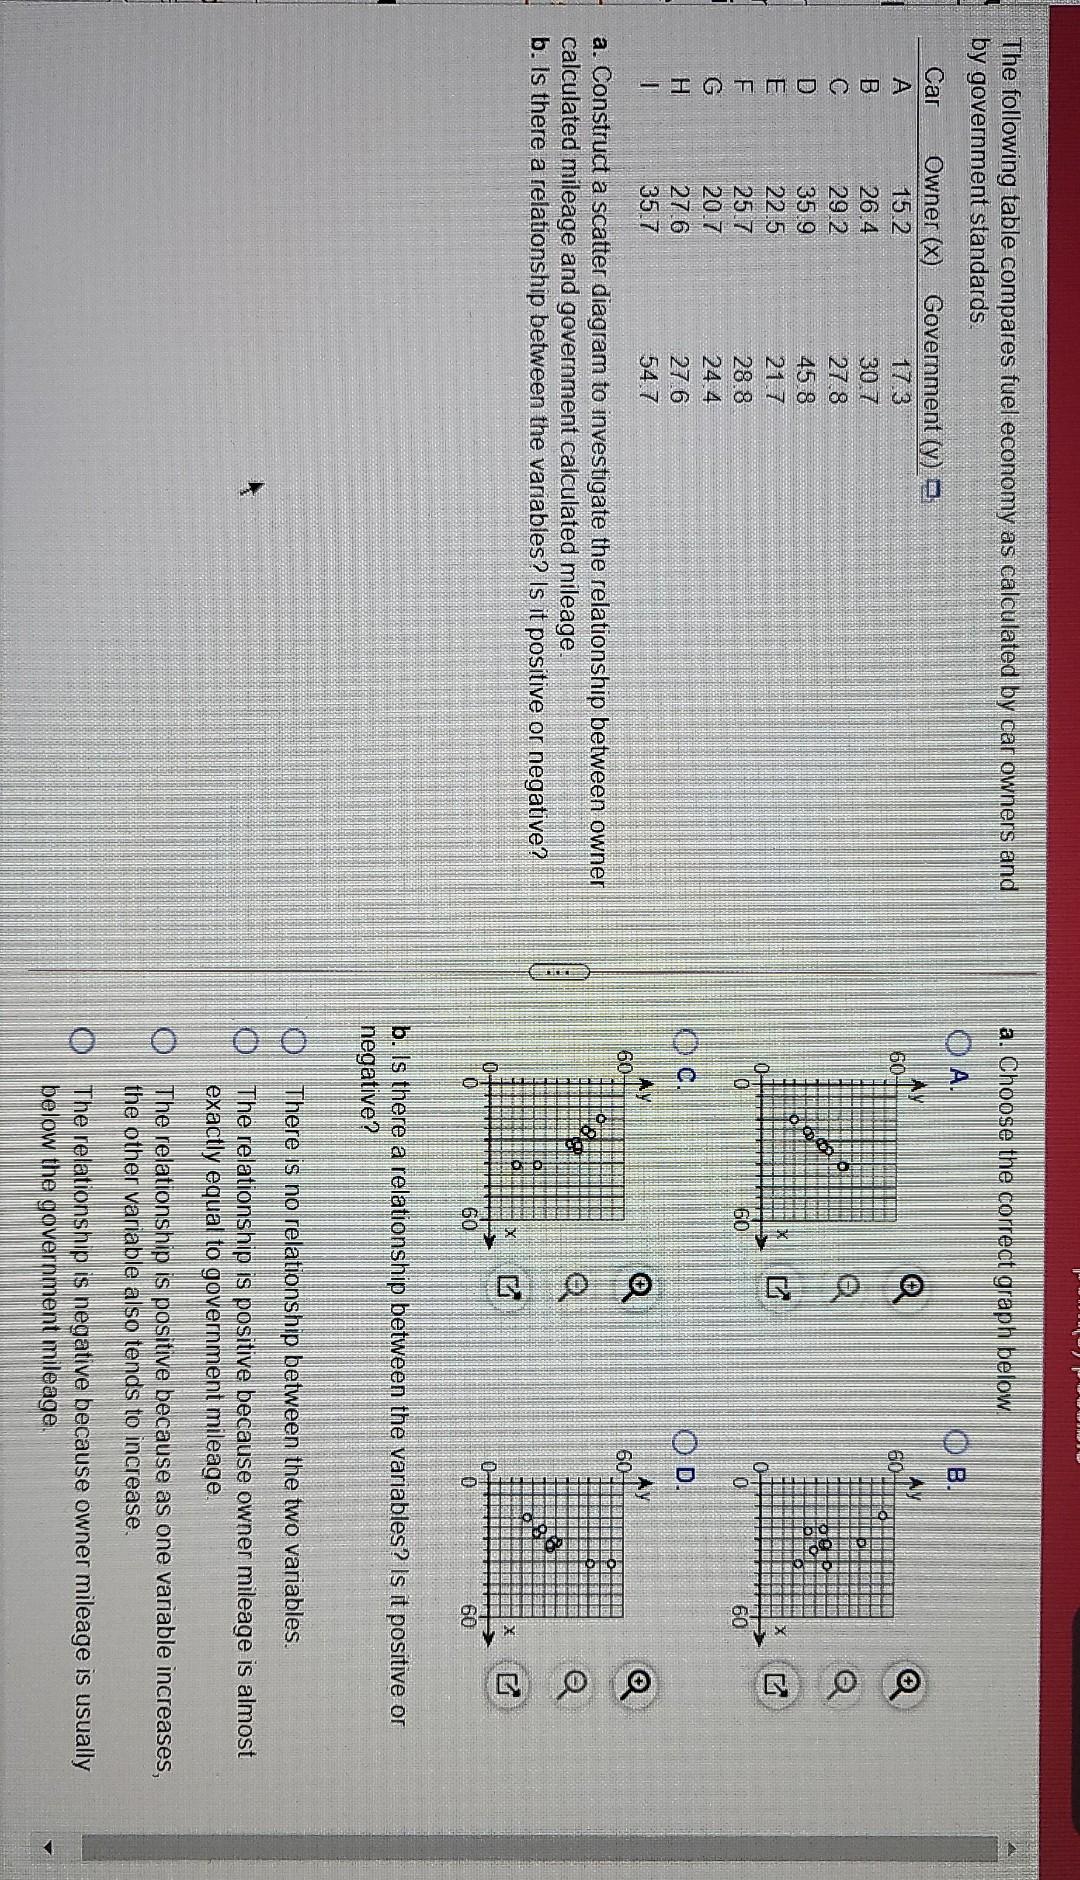
a. Choose the correct graph below OA DB. 60- 80- 0 0 The following table compares fuel economy as calculated by car owners and by government standards. Car Owner (X) Government (y). A 15.2 17 3 26.4 30.7 29.2 27.8 35.9 45 8 22.5 21.7 25.7 28.8 20.7 24.4 27.6 276 35.7 54.7 DO - I OM JOU 0 60 60 OD 60 60 a. Construct a scatter diagram to investigate the relationship between owner calculated mileage and government calculated mileage b. Is there a relationship between the variables? Is it positive or negative? 19 0 0 60 0 60 b. Is there a relationship between the variables? Is it positive or negative? There is no relationship between the two variables. 0 The relationship is positive because owner mileage is almost exactly equal to government mileage O The relationship is positive because as one variable increases, the other variable also tends to increase. O The relationship is negative because owner mileage is usually below the government mileage
Step by Step Solution
There are 3 Steps involved in it
Step: 1

Get Instant Access to Expert-Tailored Solutions
See step-by-step solutions with expert insights and AI powered tools for academic success
Step: 2

Step: 3
Ace Your Homework with AI
Get the answers you need in no time with our AI-driven, step-by-step assistance
Get Started
Complacency And Collusion A Critical Introduction To Business And Financial Journalism
Authors: Keith J. Butterick
1st Edition
074533203X,1849648379