Answered step by step
Verified Expert Solution
Question
1 Approved Answer
A common task is plotting a function to visualize it. This may be just to have a quick look, or as a comparison against another
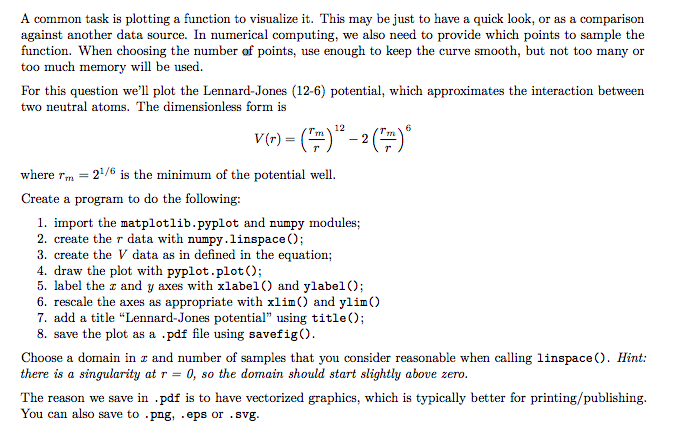
A common task is plotting a function to visualize it. This may be just to have a quick look, or as a comparison against another data source. In numerical computing, we also need to provide which points to sample the function. When choosing the number of points, use enough to keep the curve smooth, but not too many or too much memory will be used. For this question we'll plot the Lennard-Jones (12-6) potential, which approximates the interaction between two neutral atoms. The dimensionless form is v) where Tm 21/6 is the minimum of the potential well. Create a program to do the following: 1. import the matplotlib.pyplot and numpy modules; 2. create the r data with numpy.linspace); 3. create the V data as in defined in the equation; 4. draw the plot with pyplot.plot); 5. label the z and y axes with xlabel) and ylabel0; 6. rescale the axes as appropriate with xlin) and ylin) 7. add a title "Lennard-Jones potential" using titleO; 8. save the plot as a pdf file using savefig) Choose a domain in z and number of samples that you consider reasonable when calling linspace ). Hint: there is a singularity at r = 0, so the domain should start slightly above zero. The reason we save in .pdf is to have vectorized graphics, which is typically better for printing/publishing You can also save to png, .eps or .svg
Step by Step Solution
There are 3 Steps involved in it
Step: 1
Get Instant Access to Expert-Tailored Solutions
See step-by-step solutions with expert insights and AI powered tools for academic success
Step: 2
Step: 3
Ace Your Homework with AI
Get the answers you need in no time with our AI-driven, step-by-step assistance
Get Started