

Question
A company bakes computer chips in two ovens, oven A and oven B. The chips are randomly assigned to an oven and hundreds of chips

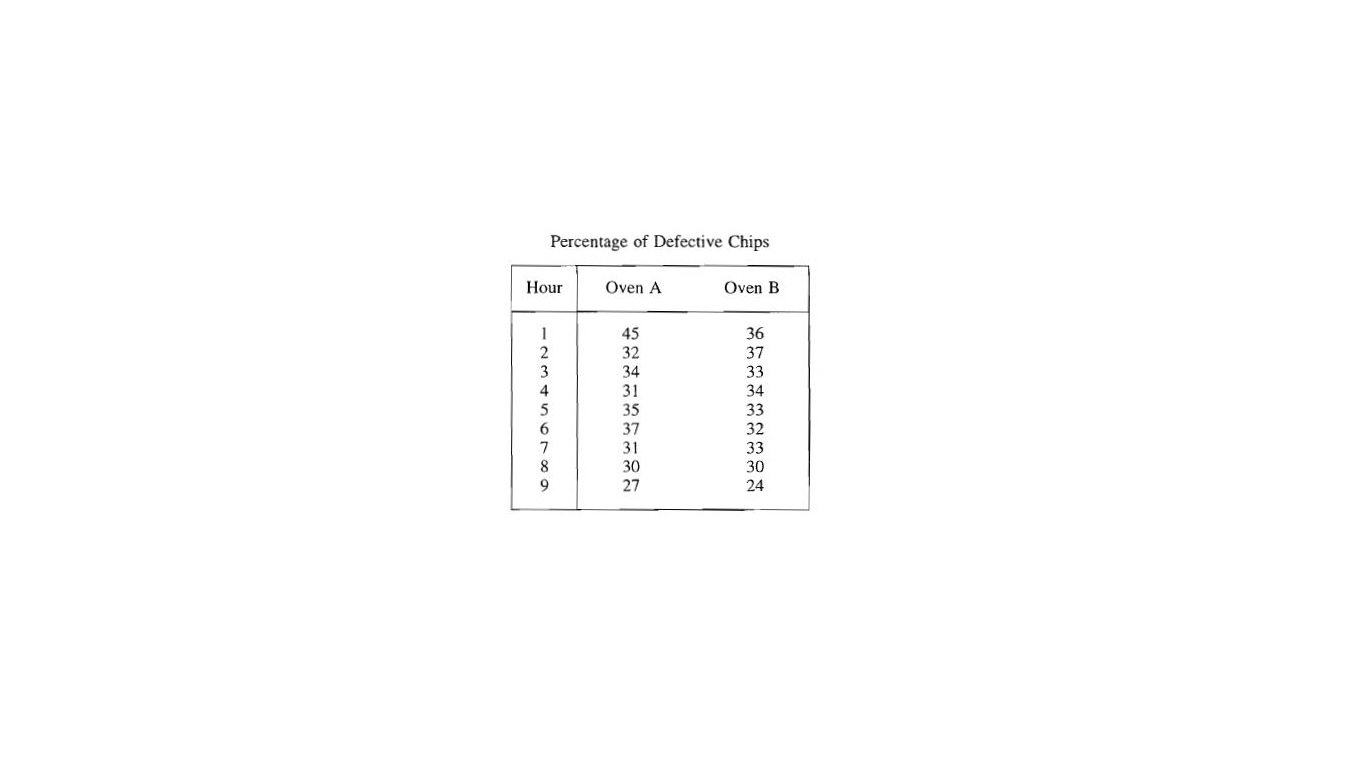
A company bakes computer chips in two ovens, oven A and oven B. The chips are randomly assigned to an oven and hundreds of chips are baked each hour. The percentage of defective chips coming from these ovens for each hour of production throughout a day is shown below. The percentage of defective chips produced each hour by oven A has a mean of 33.56 and a standard deviation of 5.20. The percentage of defective chips produced each hour by oven B has a mean of 32.44 and a standard deviation of 3.78. The hourly differences in percentages for oven A minus oven B have a mean of 1.11 and a standard deviation of 4.28. Does there appear to be a difference between oven A and oven B with respect to the mean percentages of defective chips produced? Give appropriate statistical evidence to support your answer.
Step by Step Solution
There are 3 Steps involved in it
Step: 1

Get Instant Access to Expert-Tailored Solutions
See step-by-step solutions with expert insights and AI powered tools for academic success
Step: 2

Step: 3
Ace Your Homework with AI
Get the answers you need in no time with our AI-driven, step-by-step assistance
Get Started
Elementary Linear Programming With Applications
Authors: Bernard Kolman, Robert E Beck
2nd Edition
0080530796, 9780080530796