A company faces a stream of obligations over the next 8 years as shown: where the numbers denote thousands of dollars. The spot rate curve is that of Example 4.8. Try to find a portfolio, consisting of the two bonds described in that example, that has the same present value as the obligation stream and is immunized against an additive shift in the spot rate curve.
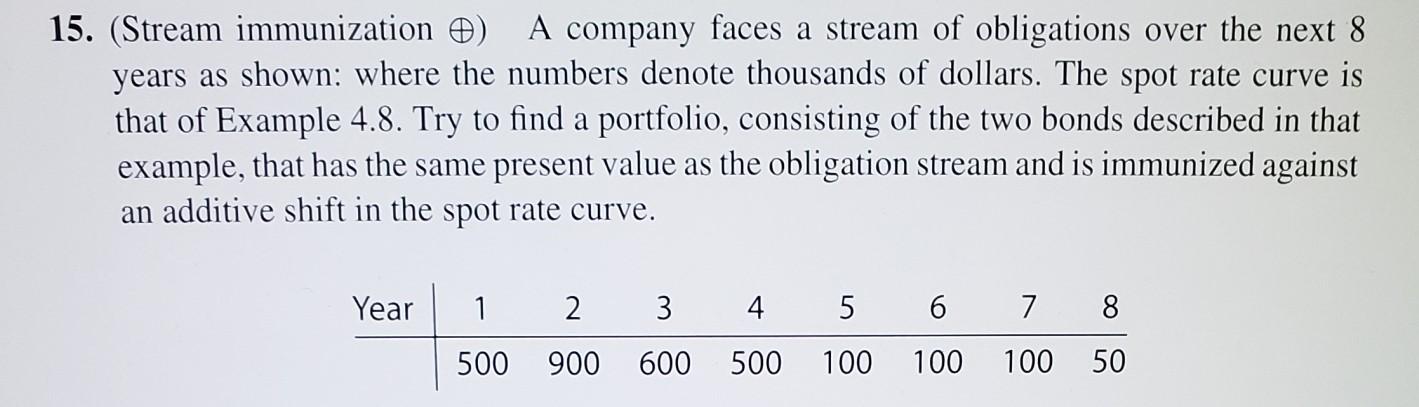
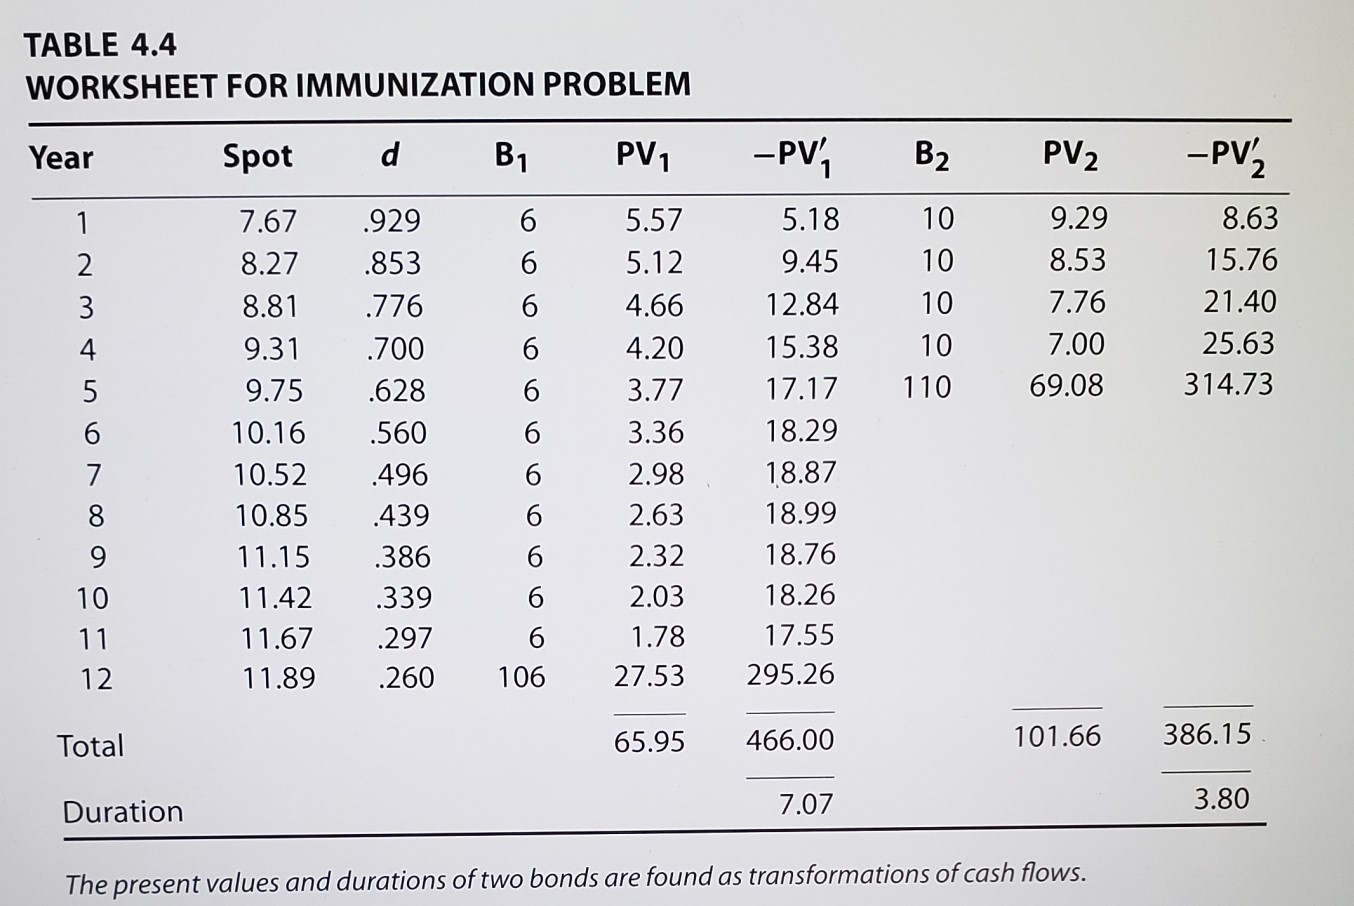
15. (Stream immunization ) A company faces a stream of obligations over the next 8 years as shown: where the numbers denote thousands of dollars. The spot rate curve is that of Example 4.8. Try to find a portfolio, consisting of the two bonds described in that example, that has the same present value as the obligation stream and is immunized against an additive shift in the spot rate curve. Year 1 2 3 4. 5 6 7 8 500 900 600 500 100 100 100 50 TABLE 4.4 WORKSHEET FOR IMMUNIZATION PROBLEM Year Spot d B1 PV1 -PV' B2 PV2 -PV2 6 6 6 6 6 10 10 10 10 110 9.29 8.53 7.76 7.00 69.08 8.63 15.76 21.40 25.63 314.73 1 2 3 4 5 6 7 8 9 10 11 12 7.67 8.27 8.81 9.31 9.75 10.16 10.52 10.85 11.15 11.42 11.67 11.89 .929 .853 .776 .700 .628 .560 .496 .439 .386 .339 .297 .260 5.57 5.12 4.66 4.20 3.77 3.36 2.98 2.63 2.32 2.03 1.78 27.53 5.18 9.45 12.84 15.38 17.17 18.29 18.87 18.99 18.76 18.26 17.55 295.26 6 6 6 6 6 106 Total 65.95 466.00 101.66 386.15 Duration 7.07 3.80 The present values and durations of two bonds are found as transformations of cash flows. 15. (Stream immunization ) A company faces a stream of obligations over the next 8 years as shown: where the numbers denote thousands of dollars. The spot rate curve is that of Example 4.8. Try to find a portfolio, consisting of the two bonds described in that example, that has the same present value as the obligation stream and is immunized against an additive shift in the spot rate curve. Year 1 2 3 4. 5 6 7 8 500 900 600 500 100 100 100 50 TABLE 4.4 WORKSHEET FOR IMMUNIZATION PROBLEM Year Spot d B1 PV1 -PV' B2 PV2 -PV2 6 6 6 6 6 10 10 10 10 110 9.29 8.53 7.76 7.00 69.08 8.63 15.76 21.40 25.63 314.73 1 2 3 4 5 6 7 8 9 10 11 12 7.67 8.27 8.81 9.31 9.75 10.16 10.52 10.85 11.15 11.42 11.67 11.89 .929 .853 .776 .700 .628 .560 .496 .439 .386 .339 .297 .260 5.57 5.12 4.66 4.20 3.77 3.36 2.98 2.63 2.32 2.03 1.78 27.53 5.18 9.45 12.84 15.38 17.17 18.29 18.87 18.99 18.76 18.26 17.55 295.26 6 6 6 6 6 106 Total 65.95 466.00 101.66 386.15 Duration 7.07 3.80 The present values and durations of two bonds are found as transformations of cash flows