Answered step by step
Verified Expert Solution
Question
1 Approved Answer
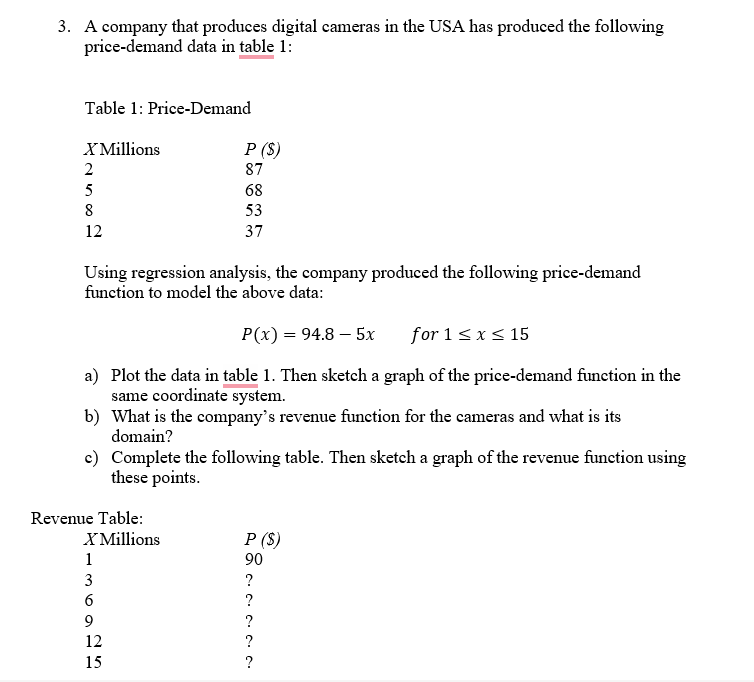
A company that produces digital cameras in the USA has produced the following price-demand data in table 1 : Table 1: Price-Demand Using regression analysis,
 A company that produces digital cameras in the USA has produced the following price-demand data in table 1 : Table 1: Price-Demand Using regression analysis, the company produced the following price-demand function to model the above data: P(x)=94.85xfor1x15 a) Plot the data in table 1 . Then sketch a graph of the price-demand function in the same coordinate system. b) What is the company's revenue function for the cameras and what is its domain? c) Complete the following table. Then sketch a graph of the revenue function using these points
 Step by Step Solution
There are 3 Steps involved in it
Step: 1

Get Instant Access to Expert-Tailored Solutions
See step-by-step solutions with expert insights and AI powered tools for academic success
Step: 2

Step: 3

Ace Your Homework with AI
Get the answers you need in no time with our AI-driven, step-by-step assistance
Get Started


