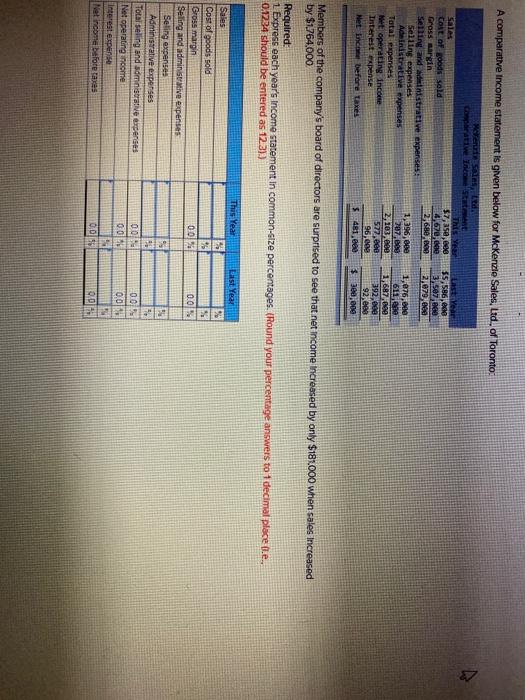
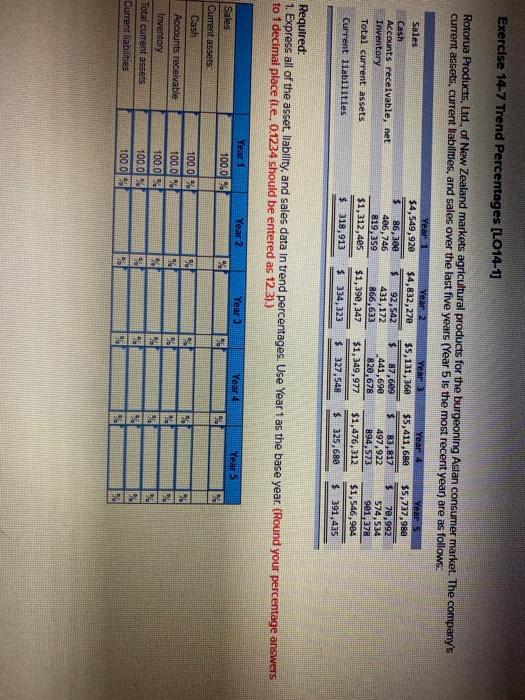
A comparative Income statement is given below for McKenzie Sales, Ltd. of Toronto Last Year 55,586,00 13, se ne 2,079, Wat sales, Ltd Comparative Income state This Year Sales $75,000 Cost of goods sald 4,670, NO Gross margin 2 680 Selling and distrative expenses: Selling expenses 1,396,000 Administrative expenses 707 08 Tatal expenses 2 103 Net operating income 572.ee Interest expense 96,000 Net Inco before taxes S481 1,076,600 6110 1,687,899 392,00 92.ee $ 30,00 Members of the company's board of directors are surprised to see that net income Increased by only $181.000 when sales increased by $1764.000 Required: 1 Express each year's Income statement in common-size percentages. (Round your percentage answers to 1 decimal place .e. 0.1234 should be entered as 123). This Year Last Year 0.01% 0.01 Sales Cost of goods sold Gross margin Selling and administrative expenses Seling expenses Administrative expenses Total selling and administrative expenses Net operating income Interest expense Net income before SI 00 0.01 0.01 0010 005 0. Exercise 14-7 Trend Percentages [LO14-1] Rotorua Products, Ltd., of New Zealand markets agricultural products for the burgeoning Aslan consumer market. The company's current assets, current Habilities, and sales over the last five years (Year 5 is the most recent year are as follows: Sales Cash Accounts receivable, net Inventory Total current assets Current liabilities Year 1 $4,549,920 3 86,300 406,746 819,359 $1,312,485 $ 318,913 Yeard $4,832,270 $ 92,542 431, 172 866,633 $1,390,347 $ 334,323 Year 3 $5,131,360 $ 87,609 441,690 820,678 $1,349,977 $ 327,548 Year 4 $5,411,680 $ 83,817 497,922 894,573 $1,476,312 $ 325,680 Year 5 $5,737,988 $ 70,992 574,534 981 378 $1,546,984 $ 391,435 Required: 1. Express all of the asset, liability, and sales data in trend percentages. Use Year 1 as the base year. (Round your percentage answers to 1 decimal place (le. 0.1234 should be entered as 123).) Year 2 Year 100,0% Year 3 Year Years 56 % Sales Current assets Cash Accounts receivable Inventory Total current assets Current liabilities 100.0% 100.0 100 01 100.0 100.0% 91


