

Question
a. Compare the common size balance sheet statements of each company. Explain and identify two major differences over time and/or between the companies using the
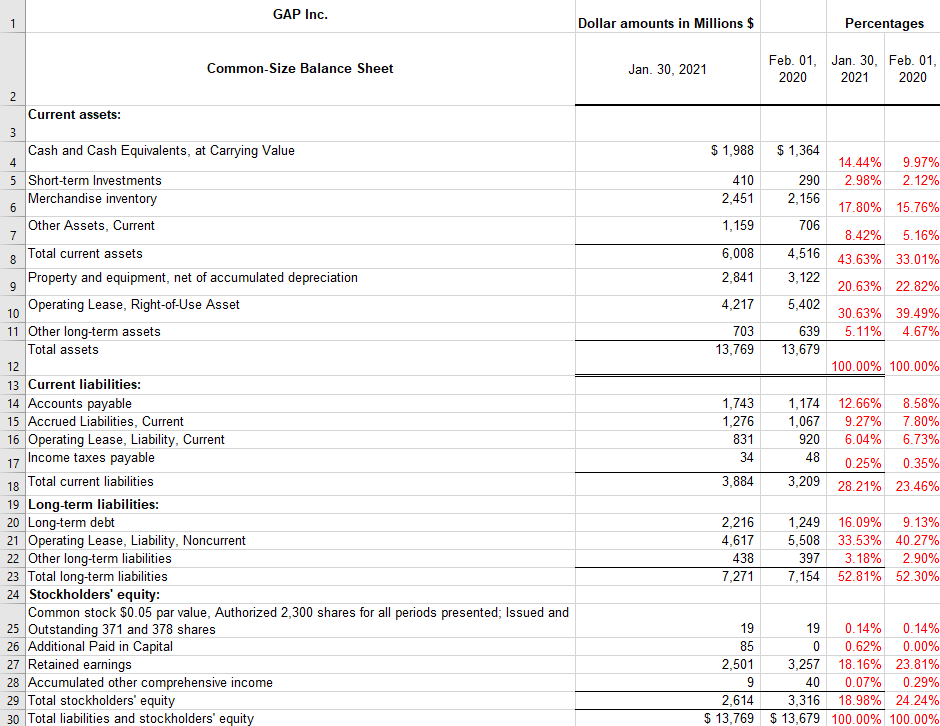
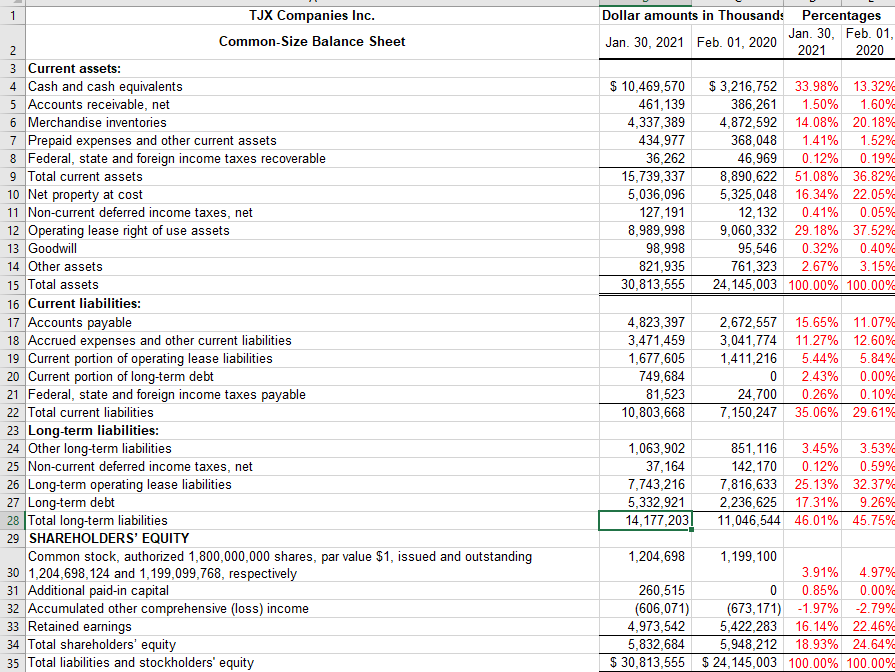
a. Compare the common size balance sheet statements of each company. Explain and identify two major differences over time and/or between the companies using the common-size balance sheet statement analyses. You need to be provide at least two common-size percentages for each company in your comparison comments.
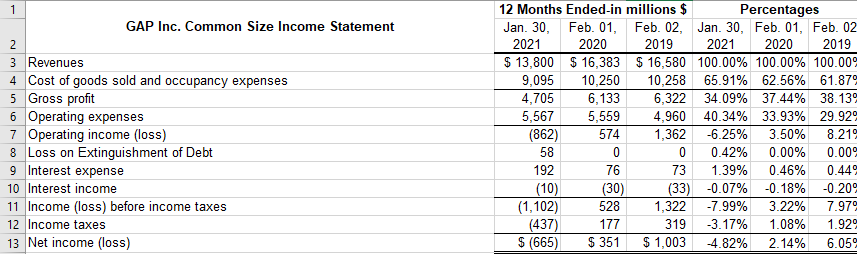
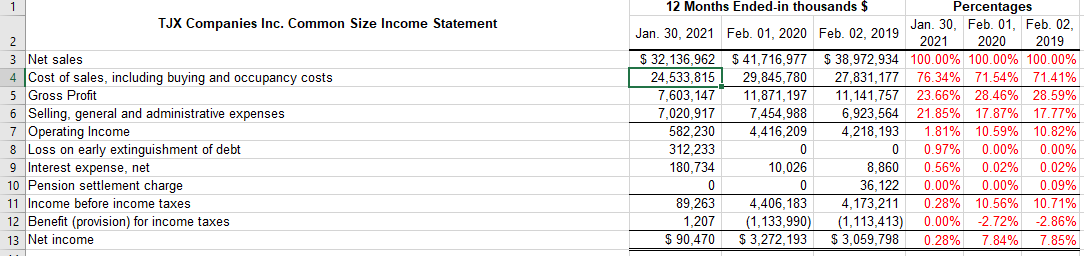
b. Which company is more profitable? Discuss specifically which accounts impacted profitability. Provide at least two common-size percentages for each company in your comparison comments. Which statement are you using to make your assessment on profitability? Compare the percentage of profit margin ratio in your ration analysis in #3 over the past 2 years. Have there been changes in this ratio from the past year?
c. Explain how the Return on Equity (ROE) has changed over time for each company? Explain how the profit margin, asset turnover, and financial leverage impacted ROE for each company. Provide the amount of the ratios for each of the companies in your explanation. Include a discussion of changes in profit margin, asset turnover, and financial leverage. Explain what each ratio is measuring. You need to identify the specific company ratios you computed in #3.
d. Explain what liquidity means. Which company is more liquid? Why? You must discuss the relevant ratio(s) that support your answer to this question from the work you completed in #3.
e. Explain what solvency means. Which company is more solvent? Why? You must discuss the relevant ratio(s) that support your answer to this question from the work you completed in #3.
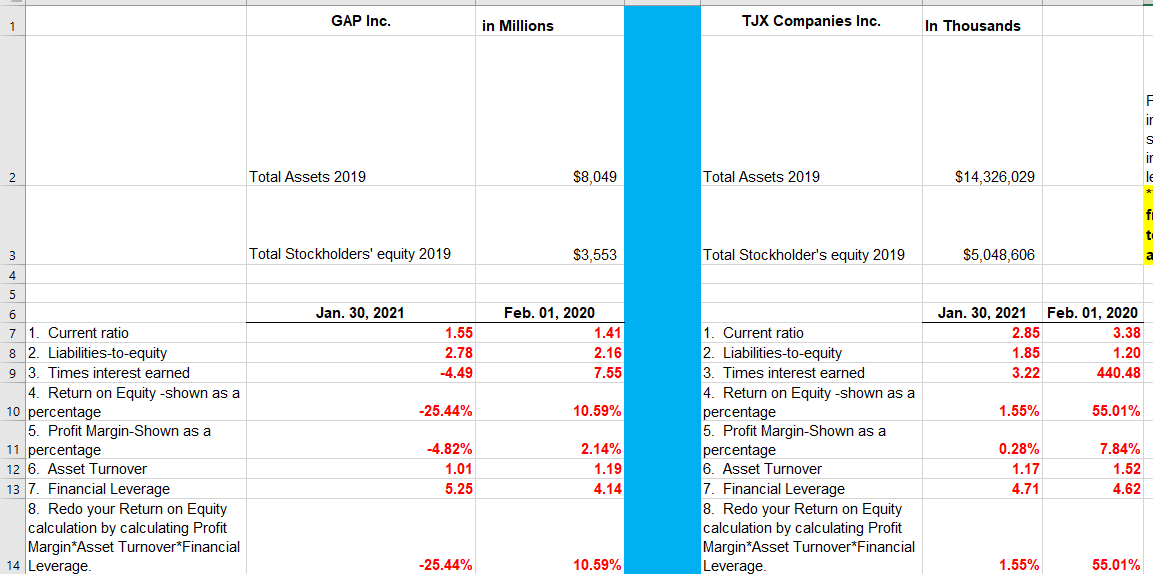
GAP Inc. 1 Dollar amounts in Millions $ Percentages Jan. 30, 2021 Feb. 01, Jan. 30, Feb. 01, 2020 2021 2020 $ 1,988 4 410 2,451 5 1,159 6,008 $ 1,364 14.44% 9.97% 290 2.98% 2.12% 2,156 17.80% 15.76% 706 8.42% 5.16% 4,516 43.63% 33.01% 3,122 20.63% 22.82% 5,402 30.63% 39.49% 639 5.11% 4.67% 13,679 100.00% 100.00% 2,841 4,217 703 13,769 Common-Size Balance Sheet 2 Current assets: 3 Cash and Cash Equivalents, at Carrying Value 5 Short-term Investments Merchandise inventory 6 Other Assets, Current 7 Total current assets 8 Property and equipment, net of accumulated depreciation 9 Operating Lease, Right-of-Use Asset 10 11 Other long-term assets Total assets 12 13 Current liabilities: 14 Accounts payable 15 Accrued Liabilities, Current 16 Operating Lease, Liability, Current 17 Income taxes payable 18 Total current liabilities 19 Long-term liabilities: 20 Long-term debt 21 Operating Lease, Liability, Noncurrent 22 Other long-term liabilities 23 Total long-term liabilities 24 Stockholders' equity: Common stock $0.05 par value, Authorized 2,300 shares for all periods presented; Issued and 25 Outstanding 371 and 378 shares 26 Additional Paid in Capital 27 Retained earnings 28 Accumulated other comprehensive income 29 Total stockholders' equity 30 Total liabilities and stockholders' equity 1,743 1,276 831 34 1,174 12.66% 8.58% 1,067 9.27% 7.80% 920 6.04% 6.73% 48 0.25% 0.35% 3,209 28.21% 23.46% 3,884 2,216 4,617 438 7,271 1,249 16.09% 9.13% 5,508 33.53% 40.27% 397 3.18% 2.90% 7,154 52.81% 52.30% 19 19 0.14% 0.14% 85 0 0.62% 0.00% 2,501 3,257 18.16% 23.81% 40 0.07% 0.29% 2,614 3,316 18.98% 24.24% $ 13,769 $ 13,679 100.00% 100.00% Dollar amounts in Thousands Percentages Jan. 30, Feb. 01, Jan. 30, 2021 Feb. 01, 2020 2021 2020 $ 10,469,570 461,139 4,337,389 434,977 36,262 15,739,337 5,036,096 127,191 8,989,998 98,998 821,935 30,813,555 $3,216,752 33.98% 13.32% 386,261 1.50% 1.60% 4,872,592 14.08% 20.18% 368,048 1.41% 1.52% 46,969 0.12% 0.19% 8,890,622 51.08% 36.82% 5,325,048 16.34% 22.05% 12,132 0.41% 0.05% 9,060,332 29.18% 37.52% 95,546 0.32% 0.40% 761,323 2.67% 3.15% 24, 145,003 100.00% 100.00% 1 TJX Companies Inc. Common-Size Balance Sheet 2 3 Current assets: 4 Cash and cash equivalents 5 Accounts receivable, net 6 Merchandise inventories 7 Prepaid expenses and other current assets 8 Federal, state and foreign income taxes recoverable 9 Total current assets 10 Net property at cost 11 Non-current deferred income taxes, net 12 Operating lease right of use assets 13 Goodwill 14 Other assets 15 Total assets 16 Current liabilities: 17 Accounts payable 18 Accrued expenses and other current liabilities 19 Current portion of operating lease liabilities 20 Current portion of long-term debt 21 Federal, state and foreign income taxes payable 22 Total current liabilities 23 Long-term liabilities: 24 Other long-term liabilities 25 Non-current deferred income taxes, net 26 Long-term operating lease liabilities 27 Long-term debt 28 Total long-term liabilities 29 SHAREHOLDERS' EQUITY Common stock, authorized 1,800,000,000 shares, par value $1, issued and outstanding 30 1,204,698,124 and 1,199,099,768, respectively 31 Additional paid-in capital 32 Accumulated other comprehensive (loss) income 33 Retained earnings 34 Total shareholders' equity 35 Total liabilities and stockholders' equity 4,823,397 3,471,459 1,677,605 749,684 81,523 10,803,668 2,672,557 3,041,774 1,411,216 0 24,700 7,150,247 15.65% 11.07% 11.27% 12.60% 5.44% 5.84% 2.43% 0.00% 0.26% 0.10% 35.06% 29.61% 1,063,902 37,164 7,743,216 5,332,921 14,177,203) 851,116 3.45% 3.53% 142,170 0.12% 0.59% 7,816,633 25.13% 32.37% 2,236,625 17.31% 9.26% 11,046,544 46.01% 45.75% 1,204,698 1,199 100 3.91% 4.97% 260,515 0 0.85% 0.00% (606,071) (673,171) -1.97% -2.79% 4,973,542 5,422,283 16.14% 22.46% 5,832,684 5,948,212 18.93% 24.64% $ 30,813,555 $ 24, 145,003 100.00% 100.00% 1 GAP Inc. Common Size Income Statement 2 3 Revenues 4 Cost of goods sold and occupancy expenses 5 Gross profit 6 Operating expenses 7 Operating income (loss) 8 Loss on Extinguishment of Debt 9 Interest expense 10 Interest income 11 Income (loss) before income taxes 12 Income taxes 13 Net income (loss) 12 Months Ended-in millions $ Percentages Jan. 30, Feb. 01, Feb. 02, Jan. 30, Feb. 01, Feb. 02 2021 2020 2019 2021 2020 2019 $ 13,800 $ 16,383 $ 16,580 100.00% 100.00% 100.009 9,095 10,250 10,258 65.91% 62.56% 61.879 4,705 6,133 6,322 34.09% 37.44% 38.139 5,567 5,559 4,960 40.34% 33.93% 29.92 (862) 574 1,362 -6.25% 3.50% 8.212 58 0 0.42% 0.00% 0.009 192 76 73 1.39% 0.46% 0.44 (10) (30) (33) -0.07% -0.18% -0.20 (1,102) 528 1,322 -7.99% 3.22% 7.979 (437) 177 319 -3.17% 1.08% 1.929 $ (665) $ 351 $ 1,003 4.82% 2.14% 6.05 TJX Companies Inc. Common Size Income Statement 2 3 Net sales 4 Cost of sales, including buying and occupancy costs 5 Gross Profit 6 Selling, general and administrative expenses 7 Operating Income 8 Loss on early extinguishment of debt 9 Interest expense, net 10 Pension settlement charge 11 Income before income taxes 12 Benefit (provision) for income taxes 13 Net income 12 Months Ended-in thousands $ Percentages Jan 30, 2021 Feb. 01, 2020 Feb. 02, 2019 Jan. 30. Feb. 01. Feb. 02, 2021 2020 2019 $ 32,136,962 $ 41,716,977 $ 38,972,934 100.00% 100.00% 100.00% 24,533,815 29,845,780 27,831,177 76.34% 71.54% 71.41% 7,603,147 11,871,197 11,141,757 23.66% 28.46% 28.59% 7,020,917 7,454,988 6.923,564 21.85% 17.87% 17.77% 582.230 4,416,209 4,218,193 1.81% 10.59% 10.82% 312,233 0 0 0.97% 0.00% 0.00% 180.734 10,026 8.860 0.56% 0.02% 0.02% 0 0 36,122 0.00% 0.00% 0.09% 89,263 4,406.183 4,173,211 0.28% 10.56% 10.71% 1,207 (1,133,990) (1,113,413) 0.00% -2.72% -2.86% $ 90,470 $ 3,272,193 $ 3,059,798 0.28% 7.84% 7.85% GAP Inc. 1 in Millions TJX Companies Inc. In Thousands ir S 2 Total Assets 2019 $8,049 Total Assets 2019 $14,326,029 ir le * f t Total Stockholders' equity 2019 $3,553 Total Stockholder's equity 2019 $5,048,606 a mnoooo Jan. 30, 2021 1.55 Feb. 01, 2020 1.41 2.16 7.55 Jan. 30, 2021 2.85 1.85 3.22 Feb. 01, 2020 3.38 1.20 440.48 2.78 -4.49 -25.44% 10.59% 1.55% 55.01% 6 7 1. Current ratio 8 2. Liabilities-to-equity 9 3. Times interest earned 4. Return on Equity-shown as a 10 percentage 5. Profit Margin-Shown as a 11 percentage 12 6. Asset Turnover 13 7. Financial Leverage 8. Redo your Return on Equity calculation by calculating Profit Margin*Asset Turnover*Financial 14 Leverage. -4.82% 1.01 5.25 2.14% 1.19 4.14 1. Current ratio 2. Liabilities-to-equity 3. Times interest earned 4. Return on Equity-shown as a percentage 5. Profit Margin-Shown as a percentage 6. Asset Turnover 7. Financial Leverage 8. Redo your Return on Equity calculation by calculating Profit Margin*Asset Turnover*Financial Leverage. 0.28% 1.17 4.71 7.84% 1.52 4.62 -25.44% 10.59% 1.55% 55.01%Step by Step Solution
There are 3 Steps involved in it
Step: 1

Get Instant Access to Expert-Tailored Solutions
See step-by-step solutions with expert insights and AI powered tools for academic success
Step: 2

Step: 3
Ace Your Homework with AI
Get the answers you need in no time with our AI-driven, step-by-step assistance
Get Started
Financial management theory and practice
Authors: Eugene F. Brigham and Michael C. Ehrhardt
12th Edition
978-0030243998, 30243998, 324422695, 978-0324422696