

Question: a. Compute the correlation of monthly returns between Stantec and Canadian Tire. b. Compute the annual standard deviation of Stantec and Canadian Tire. c. Compute
a. Compute the correlation of monthly returns between Stantec and Canadian Tire.
b. Compute the annual standard deviation of Stantec and Canadian Tire.
c. Compute the annual variance and standard deviation of a portfolio of 70% Stantec stock and 30% Canadian Tire stock.
Please BOLD final answers.
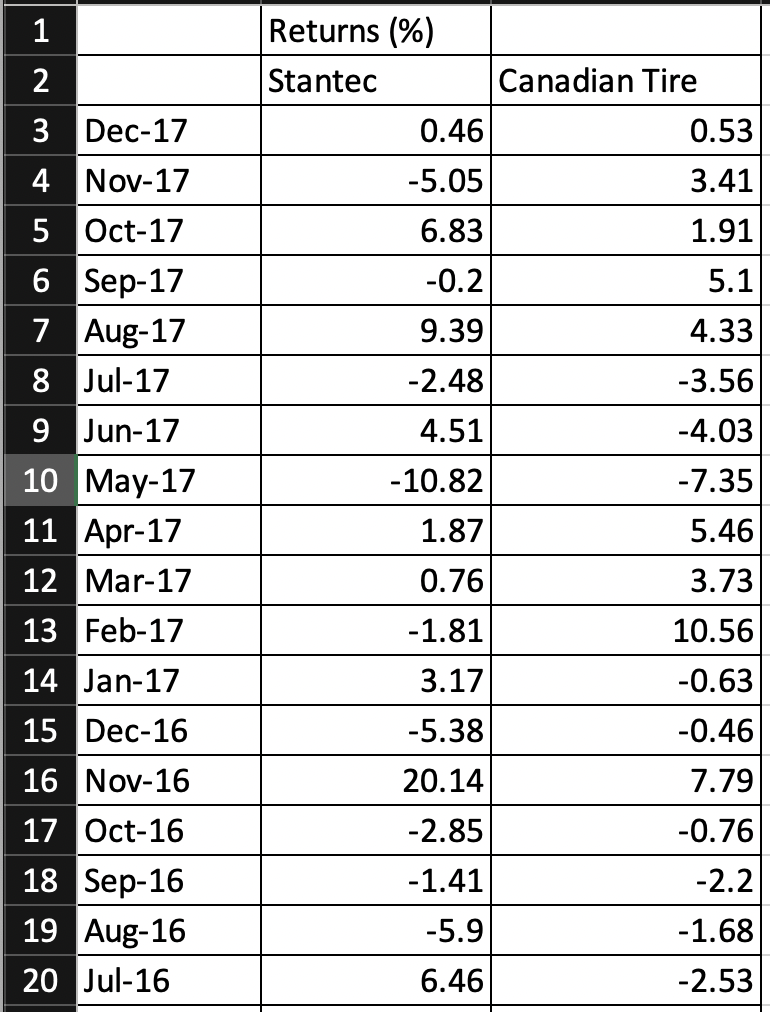
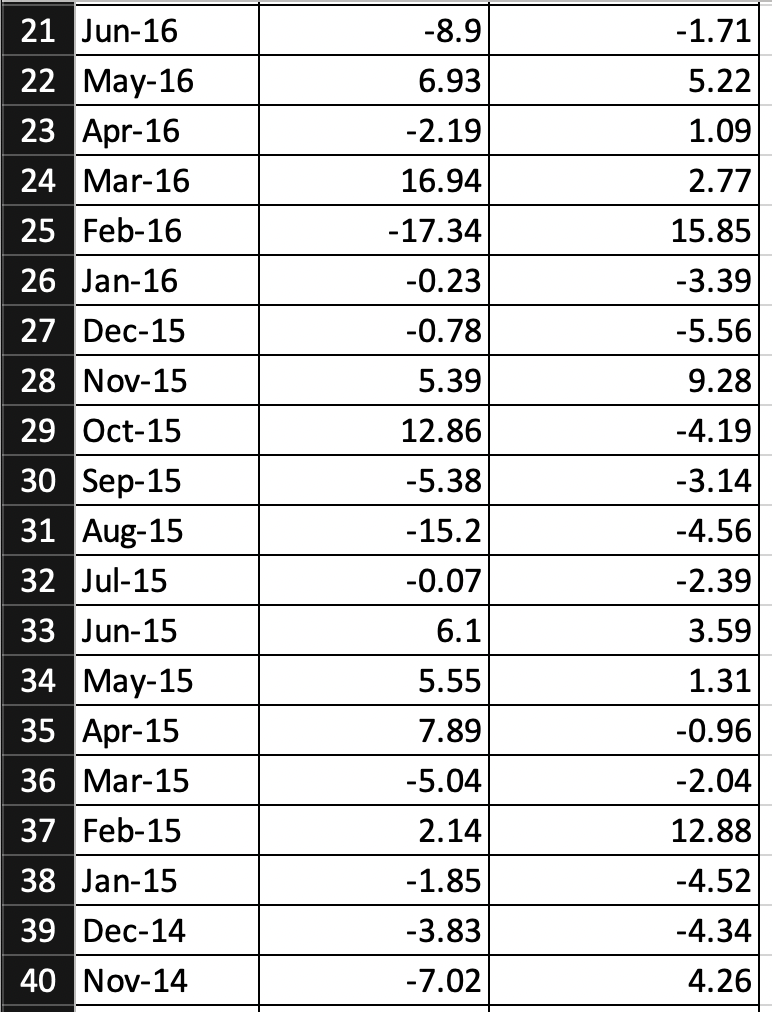
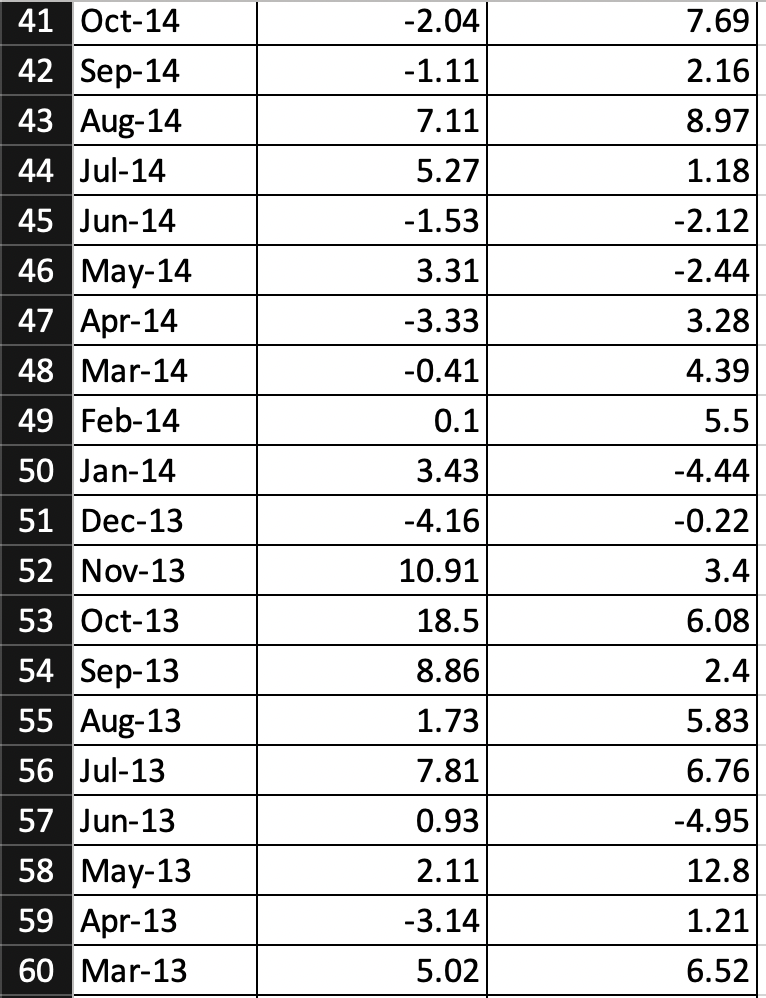
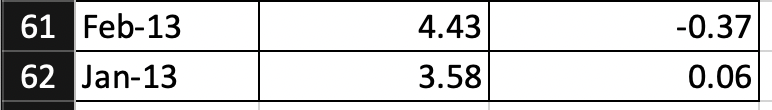
There are 62 rows
1 Returns (%) Stantec Canadian Tire 0.46 0.53 3 Dec-17 4 Nov-17 3.41 -5.05 6.83 1.91 -0.2 5.1 9.39 4.33 -2.48 -3.56 4.51 -4.03 -10.82 -7.35 5.46 1.87 0.76 5 Oct-17 6 Sep-17 7 Aug-17 8 Jul-17 9 Jun-17 10 May-17 11 Apr-17 12 Mar-17 13 Feb-17 14 Jan-17 15 Dec-16 16 Nov-16 17 Oct-16 18 Sep-16 19 Aug-16 20 Jul-16 3.73 10.56 -1.81 3.17 -0.63 -5.38 -0.46 7.79 20.14 -2.85 -0.76 -2.2 -1.41 -5.9 -1.68 6.46 -2.53 -8.9 6.93 -1.71 5.22 -2.19 1.09 16.94 2.77 15.85 -17.34 -0.23 -3.39 -5.56 -0.78 5.39 9.28 12.86 -4.19 -3.14 -5.38 21 Jun-16 22 May-16 23 Apr-16 24 Mar-16 25 Feb-16 26 Jan-16 27 Dec-15 28 Nov-15 29 Oct-15 30 Sep-15 31 Aug-15 32 Jul-15 33 Jun-15 34 May-15 35 Apr-15 36 Mar-15 37 Feb-15 38 Jan-15 39 Dec-14 40 Nov-14 -4.56 -15.2 -0.07 -2.39 3.59 6.1 5.55 1.31 7.89 -0.96 -2.04 -5.04 2.14 12.88 -1.85 -4.52 -3.83 -4.34 -7.02 4.26 7.69 -2.04 -1.11 2.16 8.97 7.11 5.27 1.18 -1.53 -2.12 -2.44 3.31 -3.33 3.28 -0.41 4.39 0.1 5.5 41 Oct-14 42 Sep-14 43 Aug-14 44 Jul-14 45 Jun-14 46 May-14 47 Apr-14 48 Mar-14 49 Feb-14 50 Jan-14 51 Dec-13 52 Nov-13 53 Oct-13 54 Sep-13 55 Aug-13 56 Jul-13 57 Jun-13 58 May-13 59 Apr-13 60 Mar-13 3.43 -4.16 -4.44 -0.22 10.91 3.4 18.5 6.08 8.86 2.4 1.73 5.83 7.81 6.76 0.93 -4.95 2.11 12.8 -3.14 1.21 5.02 6.52 4.43 -0.37 61 Feb-13 62 Jan-13 3.58 0.06
Step by Step Solution
There are 3 Steps involved in it

Get step-by-step solutions from verified subject matter experts