

Question
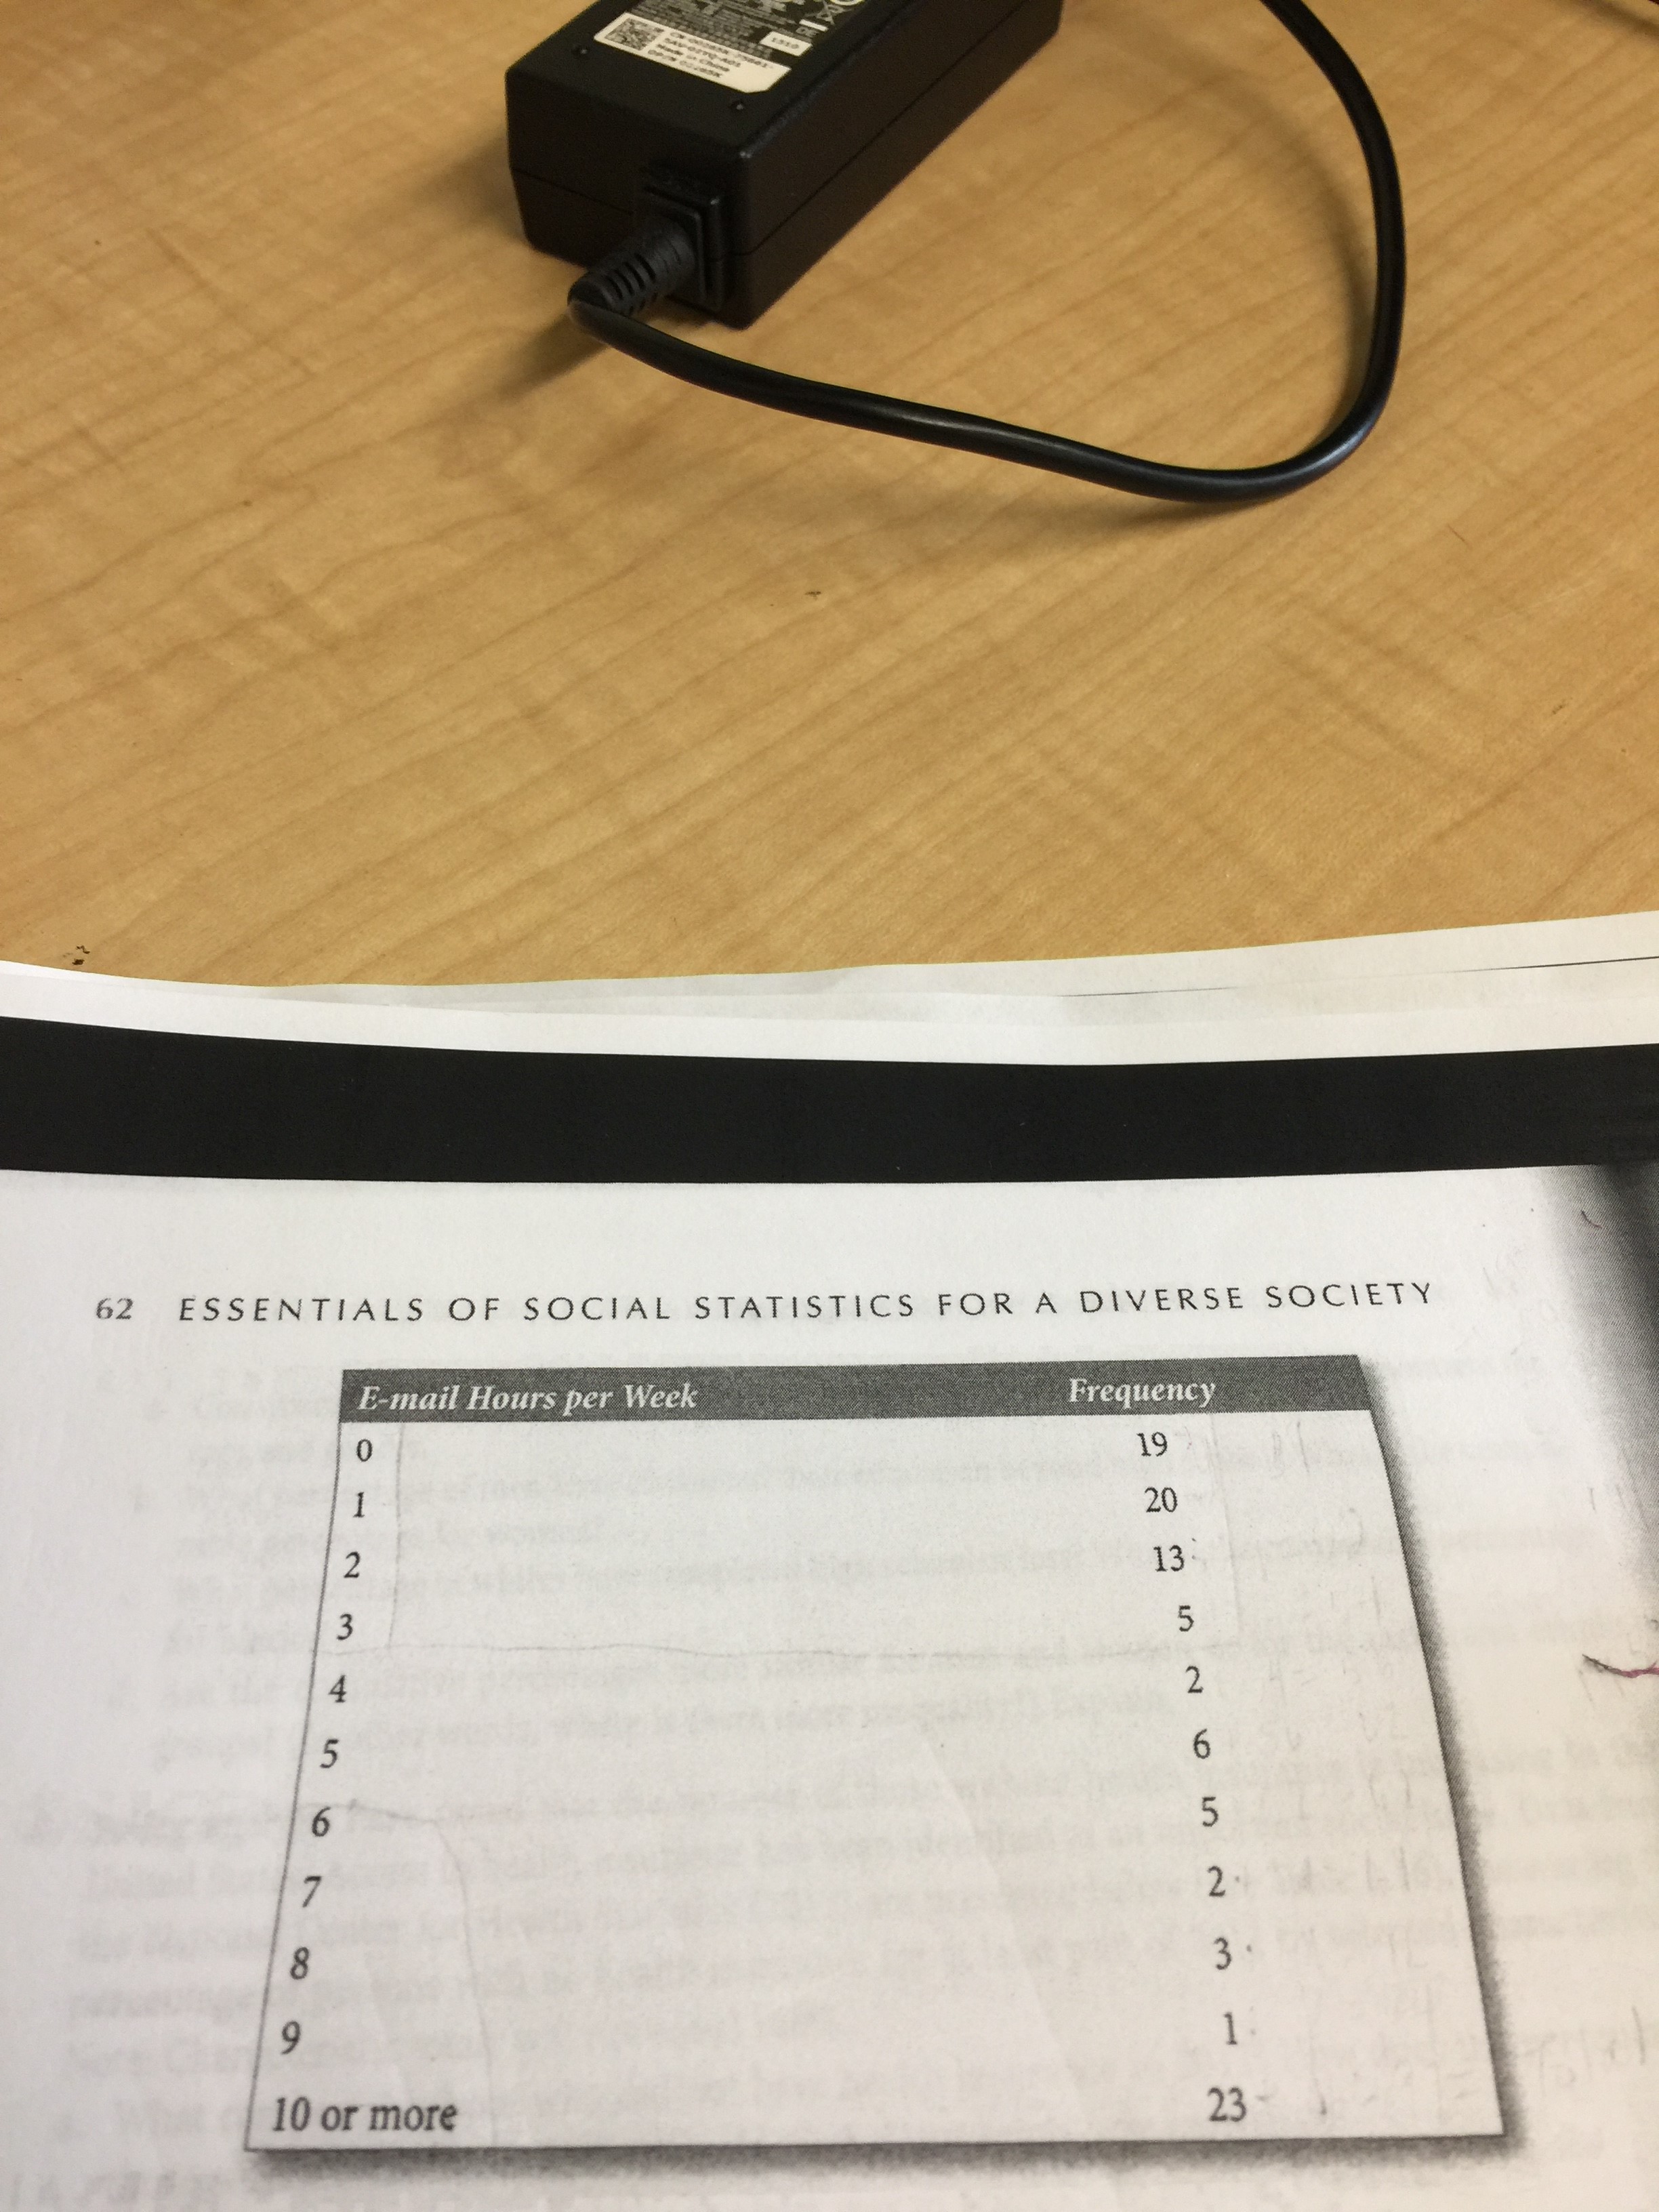
a. Compute the cumulative frequency and cumulative percentage distribution for the data. b. What proportion of the sample spent 3 hours or less per week
a. Compute the cumulative frequency and cumulative percentage distribution for the data.
b. What proportion of the sample spent 3 hours or less per week on e-mail?
c. What proportion of the sample spent 6 or more hours per week on e-mail?
d. Construct a graph or chart that best displays these data. Explain why the graph you selected is appropriate.
Step by Step Solution
There are 3 Steps involved in it
Step: 1

Get Instant Access to Expert-Tailored Solutions
See step-by-step solutions with expert insights and AI powered tools for academic success
Step: 2

Step: 3
Ace Your Homework with AI
Get the answers you need in no time with our AI-driven, step-by-step assistance
Get Started
Linear Algebra A Modern Introduction
Authors: David Poole
4th edition
1285463242, 978-1285982830, 1285982835, 978-1285463247