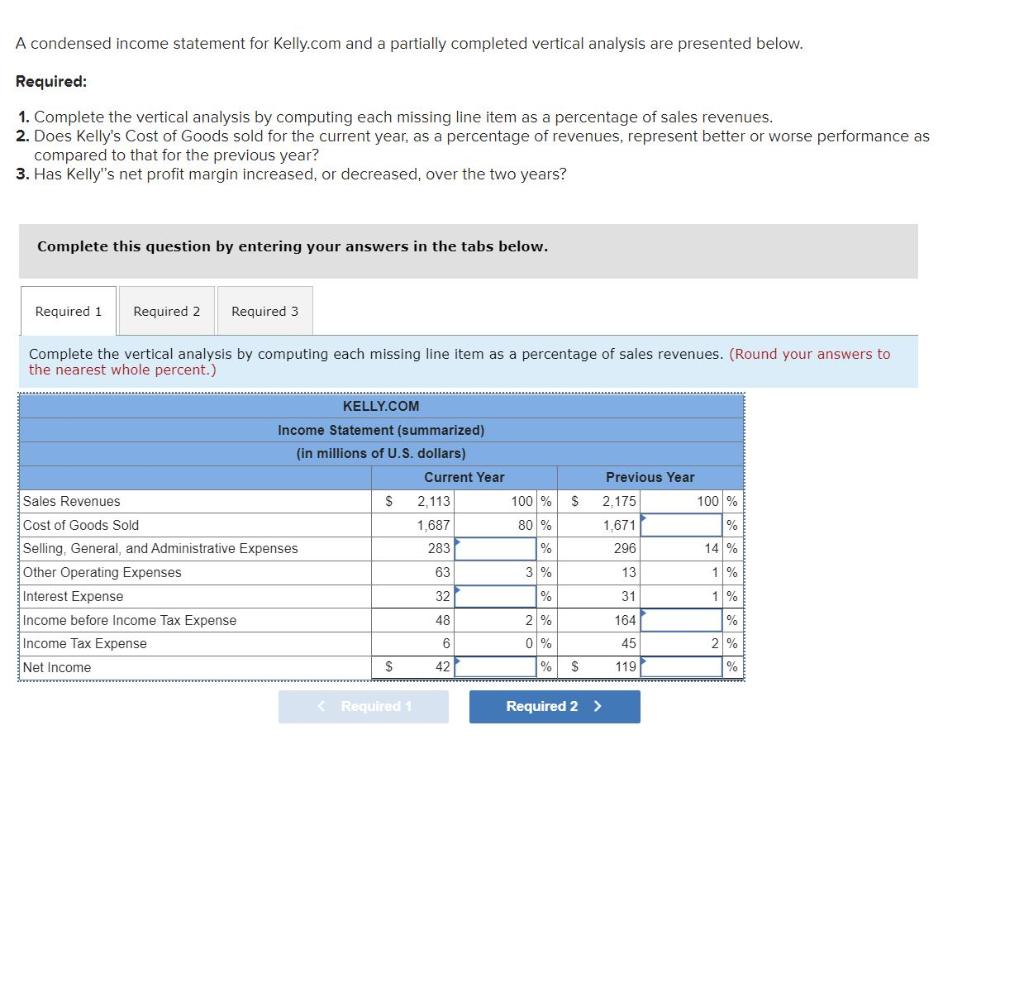
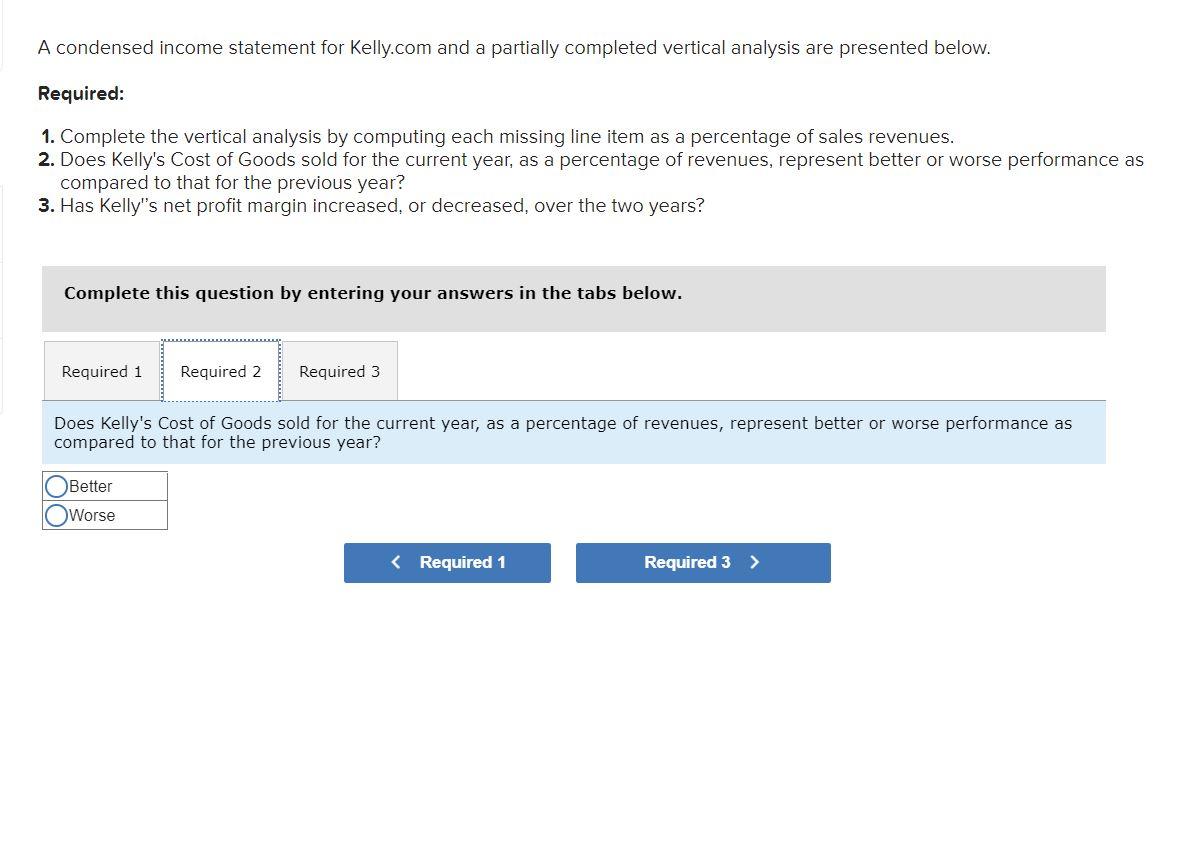
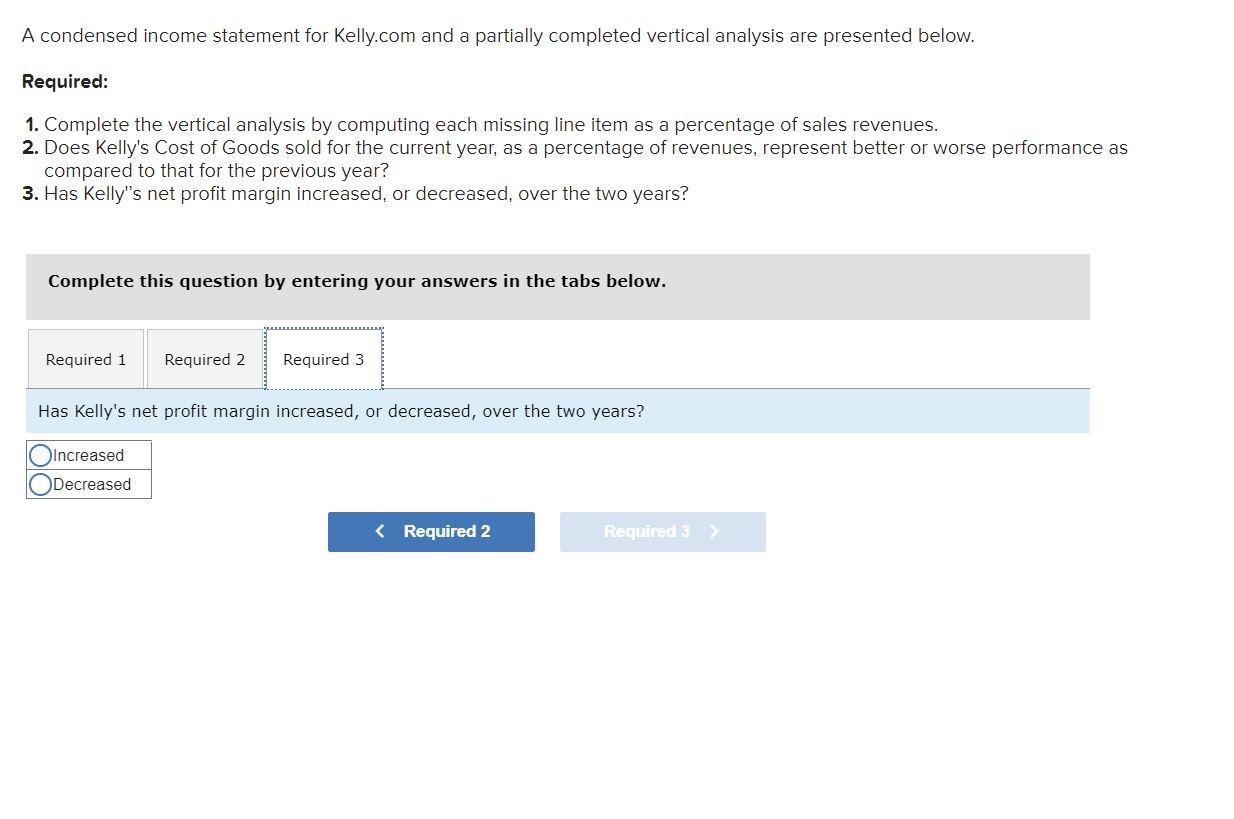
A condensed income statement for Kelly.com and a partially completed vertical analysis are presented below. Required: 1. Complete the vertical analysis by computing each missing line item as a percentage of sales revenues. 2. Does Kelly's Cost of Goods sold for the current year, as a percentage of revenues, represent better or worse performance as compared to that for the previous year? 3. Has Kelly's net profit margin increased, or decreased, over the two years? Complete this question by entering your answers in the tabs below. Required 1 Required 2 Required 3 Complete the vertical analysis by computing each missing line item as a percentage of sales revenues. (Round your answers to the nearest whole percent.) $ KELLY.COM Income Statement (summarized) (in millions of U.S. dollars) Current Year Sales Revenues $ 2.113 100% Cost of Goods Sold 1.687 80 % Selling, General, and Administrative Expenses 283 Other Operating Expenses 63 3 % Interest Expense 32 % Income before Income Tax Expense 48 2% Income Tax Expense 6 0 % Net Income S 42 % OOO Previous Year 2.175 100 % 1.671 % 296 14 % 13 1% 31 1 % 164 % 45 2% S 119 Required Required 2 > A condensed income statement for Kelly.com and a partially completed vertical analysis are presented below. Required: 1. Complete the vertical analysis by computing each missing line item as a percentage of sales revenues. 2. Does Kelly's Cost of Goods sold for the current year, as a percentage of revenues, represent better or worse performance as compared to that for the previous year? 3. Has Kelly's net profit margin increased, or decreased, over the two years? Complete this question by entering your answers in the tabs below. Required 1 Required 2 Required 3 Does Kelly's Cost of Goods sold for the current year, as a percentage of revenues, represent better or worse performance as compared to that for the previous year? Better Worse A condensed income statement for Kelly.com and a partially completed vertical analysis are presented below. Required: 1. Complete the vertical analysis by computing each missing line item as a percentage of sales revenues. 2. Does Kelly's Cost of Goods sold for the current year, as a percentage of revenues, represent better or worse performance as compared to that for the previous year? 3. Has Kelly's net profit margin increased, or decreased, over the two years? Complete this question by entering your answers in the tabs below. Required 1 Required 2 Required 3 Has Kelly's net profit margin increased, or decreased, over the two years? O Increased O Decreased Pinnacle Plus declared and paid a cash dividend of $7,500 in the current year. Its comparative financial statements, prepared at December 31, reported the following summarized information: Required: 1. Complete the two final columns shown beside each item in Pinnacle Plus's comparative financial statements. 2-a. Which account increased by the largest dollar amount? 2-b. Which account increased by the largest percentage? Answer is not complete. Complete this question by entering your answers in the tabs below. Reg 1 Req 2A Req 2B Complete the two final columns shown beside each item in Pinnacle Plus's comparative financial statements. (Decreases should be indicated by a minus sign. Round percentage values to 1 decimal place.) PINNACLE PLUS Horizontal Analysis Current Year Previous Year Increase (Decrease) in the Current year (versus Previous year) Amount Percentage IS $ 119,000 53,800 65,200 $ 105,300 48.900 13,700 4.900 8,800 5,250 OOOO 13.0 % 10.0 % % 15.6 % 56.400 14.9% 0.0 % 40,500 4,900 19 800 5.940 13,860 35,250 4.900 16.250 4.875 11.375 21.8% 3,550 1,065 2.485 oool 21.8% 21.8% IS $ $ $ $ 92.9% Income Statement Sales Revenue Cost of Goods Sold Gross Profit Operating Expenses Interest Expense Income before Income Tax Expense Income Tax Expense (30%) Net Income Balance Sheet Cash Accounts Receivable, Net Inventory Property and Equipment, Net Total Assets Accounts Payable Income Tax Payable Notes Payable (long-term) Total Liabilities Common Stock (par $10) Retained Earnings Total Liabilities and Stockholders' Equity 37,200 10.200 84.3% % % 34,560 8.600 (13,900) X (13,600) X 15,660 7,900 1,400 $ IS 71,760 18,800 25.900 95 900 $ 212,360 IS 43,800 2,800 49,000 95 600 82,000 34 760 $ 212,360 8.0 % 39.800 109 500 $ 196 700 S 35 900 1.400 49.000 O $ 22.0% 100.0 % 0.0 % 10.8% 0.0 % 86 300 9,300 > 82.000 6,360 28 400 $ 196 700 OO 22.4 8.0 % $ 15,660 C Real Req 2A >