Answered step by step
Verified Expert Solution
Link Copied!

Question

1 Approved Answer

[a) Construct a boxplot of the data. O 420 430 440 450 460 O 420 430 440 450 O 420 430 440 450 460 420
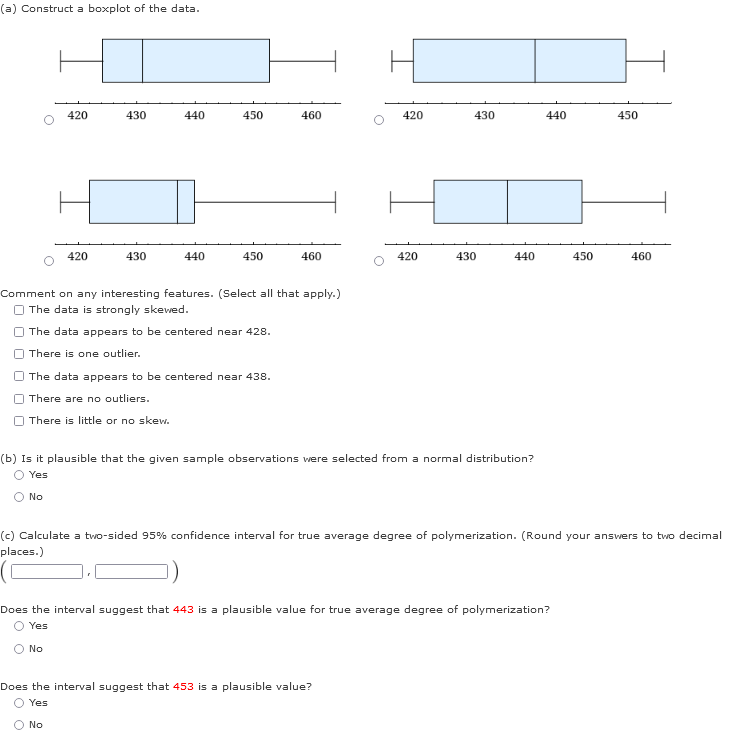
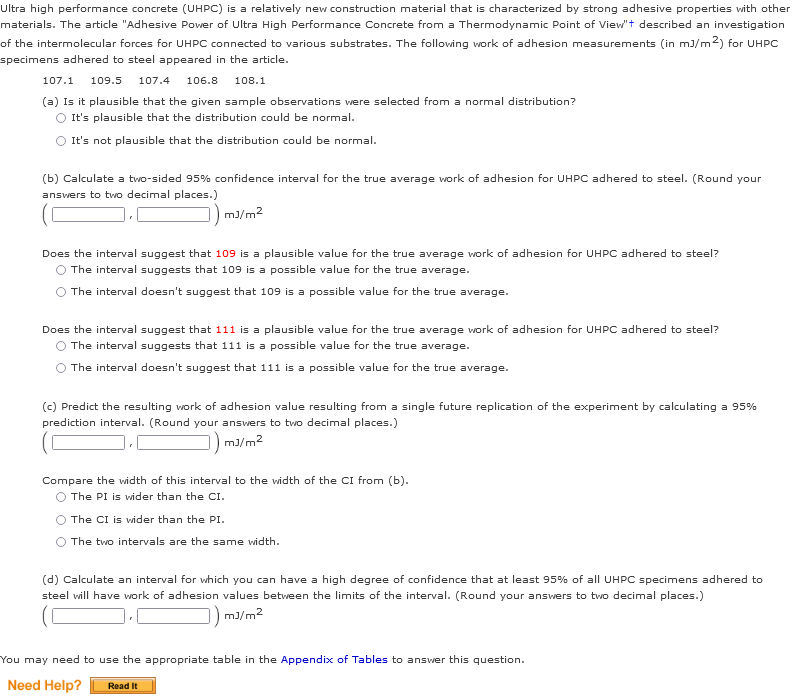
image text in transcribedimage text in transcribedimage text in transcribed
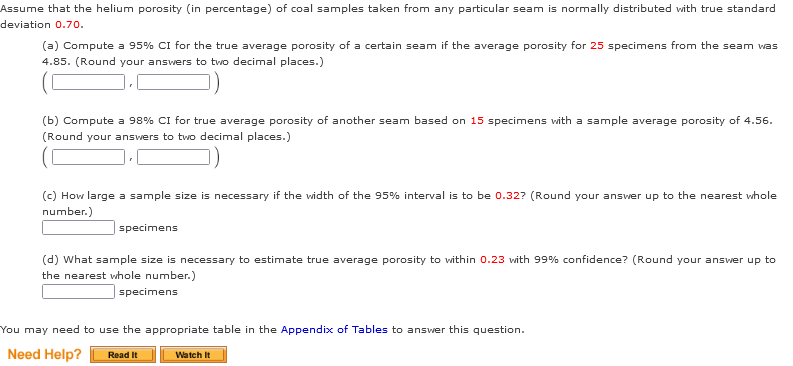
[a) Construct a boxplot of the data. O 420 430 440 450 460 O 420 430 440 450 O 420 430 440 450 460 420 430 440 450 460 Comment on any interesting features. (Select all that apply.) O The data is strongly skewed. O The data appears to be centered near 428. O There is one outlier. O The data appears to be centered near 438. O There are no outliers. O There is little or no skew. (b) Is it plausible that the given sample observations were selected from a normal distribution? O Yes O No (c) Calculate a two-sided 95% confidence interval for true average degree of polymerization. (Round your answers to two decimal places.) Does the interval suggest that 443 is a plausible value for true average degree of polymerization? O Yes O No Does the interval suggest that 453 is a plausible value? O Yes O NoUltra high performance concrete (UHPC) is a relatively new construction material that is characterized by strong adhesive properties with other materials. The article "Adhesive Power of Ultra High Performance Concrete from a Thermodynamic Point of View"t described an investigation of the intermolecular forces for UHPC connected to various substrates. The following work of adhesion measurements (in ml/m ) for UHPC specimens adhered to steel appeared in the article. 107.1 109.5 107.4 106.8 108.1 (a) Is it plausible that the given sample observations were selected from a normal distribution? O It's plausible that the distribution could be normal. It's not plausible that the distribution could be normal. (b) Calculate a two-sided 95% confidence interval for the true average work of adhesion for UHPC adhered to steel. (Round your answers to two decimal places. mJ /m2 Does the interval suggest that 109 is a plausible value for the true average work of adhesion for UHPC adhered to steel? O The interval suggests that 109 is a possible value for the true average. O The interval doesn't suggest that 109 is a possible value for the true average. Does the interval suggest that 111 is a plausible value for the true average work of adhesion for UHPC adhered to steel? The interval suggests that 111 is a possible value for the true average. O The interval doesn't suggest that 111 is a possible value for the true average. (c) Predict the resulting work of adhesion value resulting from a single future replication of the experiment by calculating a 95% prediction interval. (Round your answers to two decimal places.) mJ/ m 2 Compare the width of this interval to the width of the CI from (b). O The PI is wider than the CI. O The CI is wider than the PI. O The two intervals are the same width. (d) Calculate an interval for which you can have a high degree of confidence that at least 95% of all UHPC specimens adhered to steel will have work of adhesion values between the limits of the interval. (Round your answers to two decimal places.) MJ /m2 You may need to use the appropriate table in the Appendix of Tables to answer this question. Need Help? Read ItAssume that the helium porosity (in percentage) of coal samples taken from any particular seam is normally distributed with true standard deviation 0.70. (a) Compute a 95% CI for the true average porosity of a certain seam if the average porosity for 25 specimens from the seam was 4.85. (Round your answers to two decimal places.) (b) Compute a 98% CI for true average porosity of another seam based on 15 specimens with a sample average porosity of 4.56. (Round your answers to two decimal places.) (c) How large a sample size is necessary if the width of the 95% interval is to be 0.327 (Round your answer up to the nearest whole number.) specimens (d) What sample size is necessary to estimate true average porosity to within 0.23 with 99% confidence? (Round your answer up to the nearest whole number.) specimens You may need to use the appropriate table in the Appendix of Tables to answer this question. Need Help? Read It Watch It
Step by Step Solution

There are 3 Steps involved in it

Step: 1

blur-text-image

Get Instant Access to Expert-Tailored Solutions

See step-by-step solutions with expert insights and AI powered tools for academic success

Step: 2

blur-text-image_2

Step: 3

blur-text-image_3

Ace Your Homework with AI

Get the answers you need in no time with our AI-driven, step-by-step assistance

Get Started

Recommended Textbook for

Applied Calculus

Authors: Stefan Waner, Steven Costenoble

6th Edition

1285415310, 9781285415314

More Books

Students also viewed these Mathematics questions

Question

discuss the four components of effective leadership.

Answered: 1 week ago

Question

At what level(s) was this OD intervention scoped?

Answered: 1 week ago