Answered step by step
Verified Expert Solution
Link Copied!

Question

1 Approved Answer

A consulting company has recently implemented a mentorship program to reduce turnover intention of junior consultants. HR department surveyed 78 pairs of mentors and mentees.

A consulting company has recently implemented a mentorship program to reduce turnover intention of junior consultants. HR department surveyed 78 pairs of mentors and mentees. In the mentor survey, HR department asked mentors how often they discussed career-related issues with their mentees (Responses were on a 5-point Likert-type scale, 1 = not at all, 5 = very frequently). In the mentee survey, HR department asked mentees the extent to which they will leave the current company in the next 6 months (Responses were on a 5-point Likert-type scale, 1 = very unlikely, 5 = very likely). HR department wanted to know whether there is a relationship between the two variables.

Independence Chi-square test

Two paired sample mean comparison

Two-way ANOVA

Correlation

A company planned to offer some new child care benefits to its employees. Before it decided which benefit should be used, it conducted a poll to ask its employees which of the following three benefits was most needed (1 = on-site child care center, 2 = flexible spending accounts, and 3 = flexible work schedules). The company wanted to examine whether there was an association between gender (1 = male, 2 = female) and the choice of child care benefits.

Two paired sample mean comparison

Independence Chi-square test

Two-way ANOVA

Simple regression

A research team in Singapore has recently found that companies using more work-life benefits tend to have better financial performance. The research team collected a large-scale survey data from 2,570 firms. In the survey, the research team asked how many work-life benefits a firm offered to its employees. They also collected ROA (return on assets, a continuous measure of financial performance) of each firm. In order to examine the relationship between the number of work-life benefits and ROA, the research team has probably used:

Independence Chi-square test

Two paired sample mean comparison

One-way ANOVA

Regression

The average GPA of MHRM applicants in the past three years was 3.35. This program received 300 applications this year and wanted to examine whether the average GPA of this year's applicants was significantly different from 3.35.

Two independent sample mean comparison

Two paired sample mean comparison

Two-way ANOVA

Single mean comparison
An applicant of the MHRM program asked whether those whose applications were accepted and those whose applications were denied differed in the average GMAT scores. The program office wanted to examine this question by using last year's application data.

Two independent sample mean comparison

Two paired sample mean comparison

Two-way ANOVA

Single mean comparison
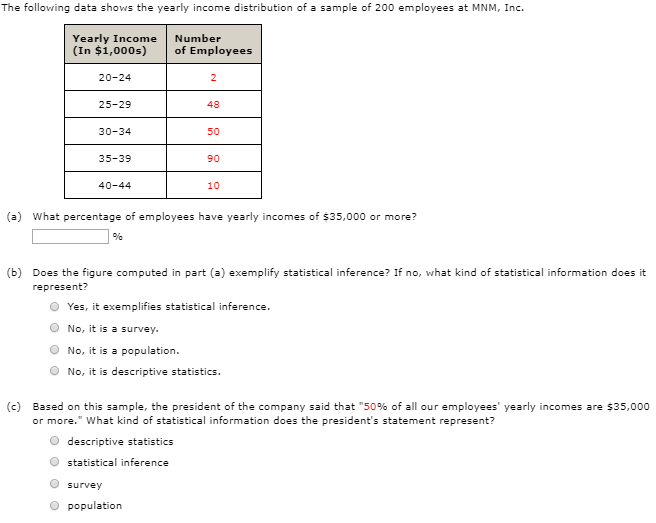
image text in transcribedimage text in transcribedimage text in transcribedimage text in transcribed
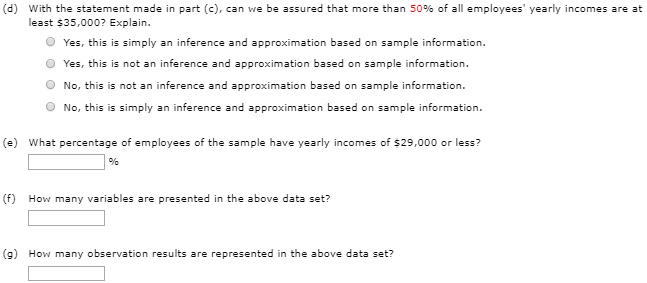
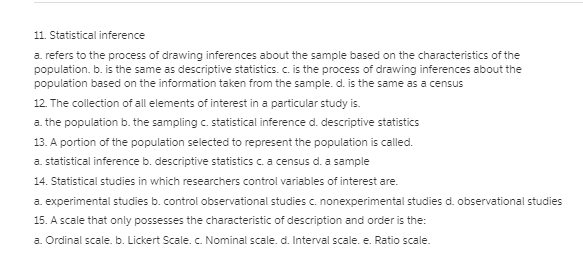
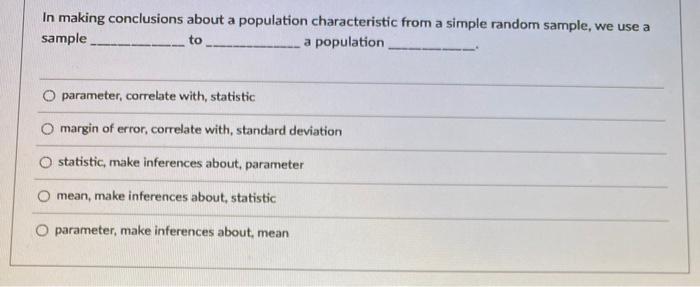
In making conclusions about a population characteristic from a simple random sample, we use a sample to a population parameter, correlate with, statistic O margin of error, correlate with, standard deviation O statistic, make inferences about, parameter mean, make inferences about, statistic O parameter, make inferences about, meanThe following data shows the yearly income distribution of a sample of 200 employees at MNM, Inc. Yearly Income Number (In $1,000s) of Employees 20-24 2 25-29 48 30-34 50 35-39 90 40-44 10 (=) What percentage of employees have yearly incomes of $35,000 or more? (b) Does the figure computed in part (a) exemplify statistical inference? If no, what kind of statistical information does it represent? O Yes, it exemplifies statistical inference. O No, it is a survey. O No, it is a population. O No, it is descriptive statistics. (c) Based on this sample, the president of the company said that "50% of all our employees" yearly incomes are $35,000 or more. "What kind of statistical information does the president's statement represent? O descriptive statistics O statistical inference O survey O population(d) With the statement made in part (c), can we be assured that more than 50% of all employees yearly incomes are at least $35,000? Explain. O Yes, this is simply an inference and approximation based on sample information. O Yes, this is not an inference and approximation based on sample information. O No, this is not an inference and approximation based on sample information. O No, this is simply an inference and approximation based on sample information. (e) What percentage of employees of the sample have yearly incomes of $29,000 or less? (f) How many variables are presented in the above data set? (g) How many observation results are represented in the above data set?:L'L Stalistical inference a. refers to the process of drawing inferences about the sample based on the characteristics of the population. lo. is the same as descriptive statistiG. c. is the process of drawing inferences about the population based on the information taken from the sample. d. is the same as a census 11 The collection ofall elements of interest in a particular stud}.r is. a. the population b. the sampling c statistical inference d. descriptive statistics 13. A portion of the population selected to represent the population is called. a. statistical inference b. descriptive statistics c. a census d. a sample 14. Statistical studies in which researchers control variables ofinterest are. a. experimental studies lo. control observational studies c. nonexpen' mental studies d. observational studies 15. A scale that only:I possesses the chamcten'stic of description and order is the: a. Drdinal scale. lo. Lickert Scale. I: Nominal scale. d. Interval scale. e. Radio scale

Step by Step Solution

There are 3 Steps involved in it

Step: 1

blur-text-image

Get Instant Access to Expert-Tailored Solutions

See step-by-step solutions with expert insights and AI powered tools for academic success

Step: 2

blur-text-image_2

Step: 3

blur-text-image_3

Ace Your Homework with AI

Get the answers you need in no time with our AI-driven, step-by-step assistance

Get Started

Recommended Textbook for

Mathematics Concepts With Applications

Authors: Charles P McKeague

1st Edition

1630983136, 9781630983130

More Books

Students also viewed these Mathematics questions