A convenience sample was drawn from the UAE population to assess salary differences among residents. The following variables were measured: 1) Salary (monthly salary


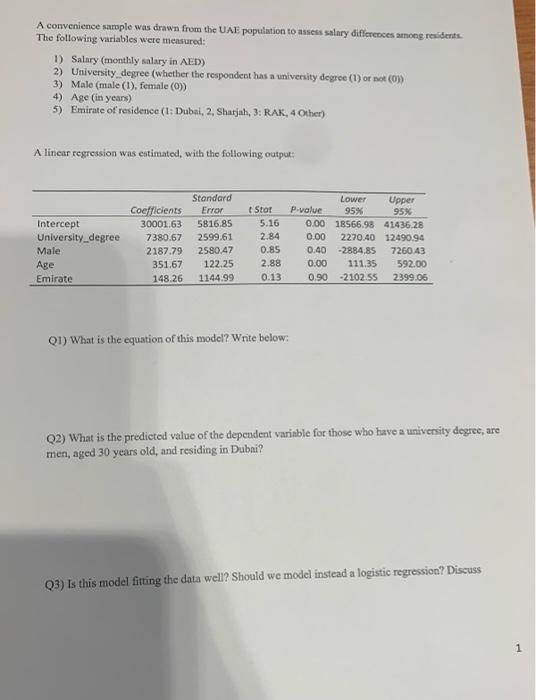
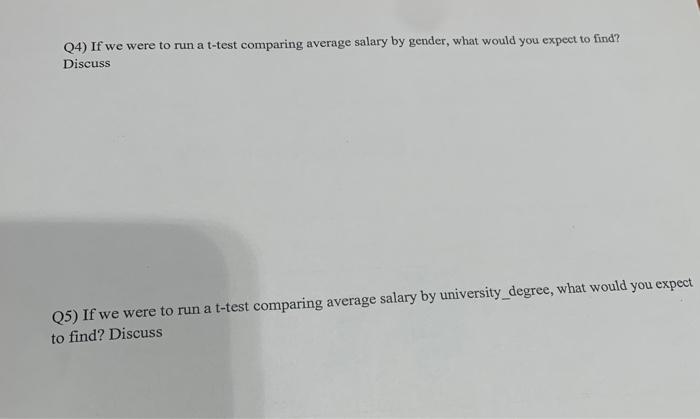
A convenience sample was drawn from the UAE population to assess salary differences among residents. The following variables were measured: 1) Salary (monthly salary in AED) 2) University degree (whether the respondent has a university degree (1) or not (0)) 3) Male (male (1), female (0)) 4) Age (in years) 5) Emirate of residence (1: Dubai, 2, Sharjah, 3: RAK, 4 Other) A linear regression was estimated, with the following output: Intercept University degree Male Age Emirate Coefficients 30001.63 Standard Error 5816.85 7380.67 2599.61 2187.79 2580.47 351.67 122.25 148.26 1144.99 t Stat 5.16 2.84 0.85 2.88 0.13 Q1) What is the equation of this model? Write below: Upper 95% 0.00 18566.98 41436.28 0.00 2270.40 12490.94 0.40 -2884.85 0.00 111.35 0.90 -2102.55 Lower 95% P-value 7260.43 592.00 2399.06 Q2) What is the predicted value of the dependent variable for those who have a university degree, are men, aged 30 years old, and residing in Dubai? Q3) Is this model fitting the data well? Should we model instead a logistic regression? Discuss 1 Q4) If we were to run a t-test comparing average salary by gender, what would you expect to find? Discuss Q5) If we were to run a t-test comparing average salary by university_degree, what would you expect to find? Discuss
Step by Step Solution
3.49 Rating (159 Votes )
There are 3 Steps involved in it
Step: 1
Q1 The equation of this linear regression model is as follows Salary 581685 218779 University degree ...
See step-by-step solutions with expert insights and AI powered tools for academic success
Step: 2

Step: 3

Ace Your Homework with AI
Get the answers you need in no time with our AI-driven, step-by-step assistance
Get Started


