

Question
A deck of cards contains RED cards numbered 1,2,3,4,5,6 , BLUE cards numbered 1,2,3,4 , and GREEN cards numbered 1,2 . If a single card
A deck of cards contains RED cards numbered 1,2,3,4,5,6 , BLUE cards numbered 1,2,3,4 , and GREEN cards numbered 1,2 . If a single card is picked at random, what is the probability that the card is NOT GREEN?
Diastolic blood pressures are approximately normally distributed with a mean of 75 and a standard deviation of 10.
a.What is the 90th percentile of diastolic blood pressure?
b.If we consider samples of 20 patients, what is the 90th percentile of the mean diastolic blood pressure?
In a survey of
210
males ages 20 to?24,
38?%
were neither in school nor working. In a survey of
220
females ages 20 to?24,
45?%
were neither in school nor working. These samples are random and independent. At
?=0.06?,
can you support the claim that the proportion of males ages 20 to 24 who were neither in school nor working is less than the proportion of females ages 20 to 24 who were neither in school nor?working? Complete parts?(a) through?(e) below.
?(a) Identify the claim and state
H0
and
Ha.
?(b) Find the critical?value(s) and identify the rejection?region(s).
The critical?value(s) is(are)
nothing.
?(Use a comma to separate answers as needed. Round to two decimal places as?needed.)
Identify the rejection?region(s). Choose the correct answer below.
?(c) Find the standardized test statistic.
z=
?(Round to two decimal places as?needed.)
?Decide whether to reject or fail to reject the null hypothesis.
Choose the correct answer below.
Failtoreject
H0.
Reject
H0.
Interpret the decision in the context of the original claim.
Choose the correct answer below.
A.
At the
6?%
significance?level, there is
insufficient
evidence to support the claim.
B.
At the
6?%
significance?level, there is
sufficient
evidence to reject the claim.
C.
At the
6?%
significance?level, there is
insufficient
evidence to reject the claim.
D.
At the
6?%
significance?level, there is
sufficient
evidence to support the claim.
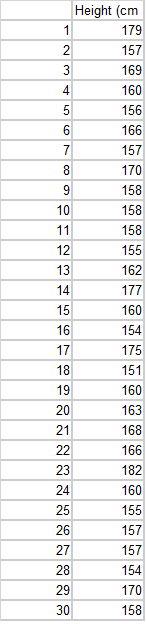
Organize the student's heights in a frequency table of 5 classes with suitable class width (class
interval). (You have to construct a table with classes, frequency, cumulative frequency, relative
frequency, and percent relative frequency).
Step by Step Solution
There are 3 Steps involved in it
Step: 1

Get Instant Access to Expert-Tailored Solutions
See step-by-step solutions with expert insights and AI powered tools for academic success
Step: 2

Step: 3
Ace Your Homework with AI
Get the answers you need in no time with our AI-driven, step-by-step assistance
Get Started
Algebra And Trigonometry
Authors: Cynthia Y Young
5th Edition
1119820898, 9781119820895