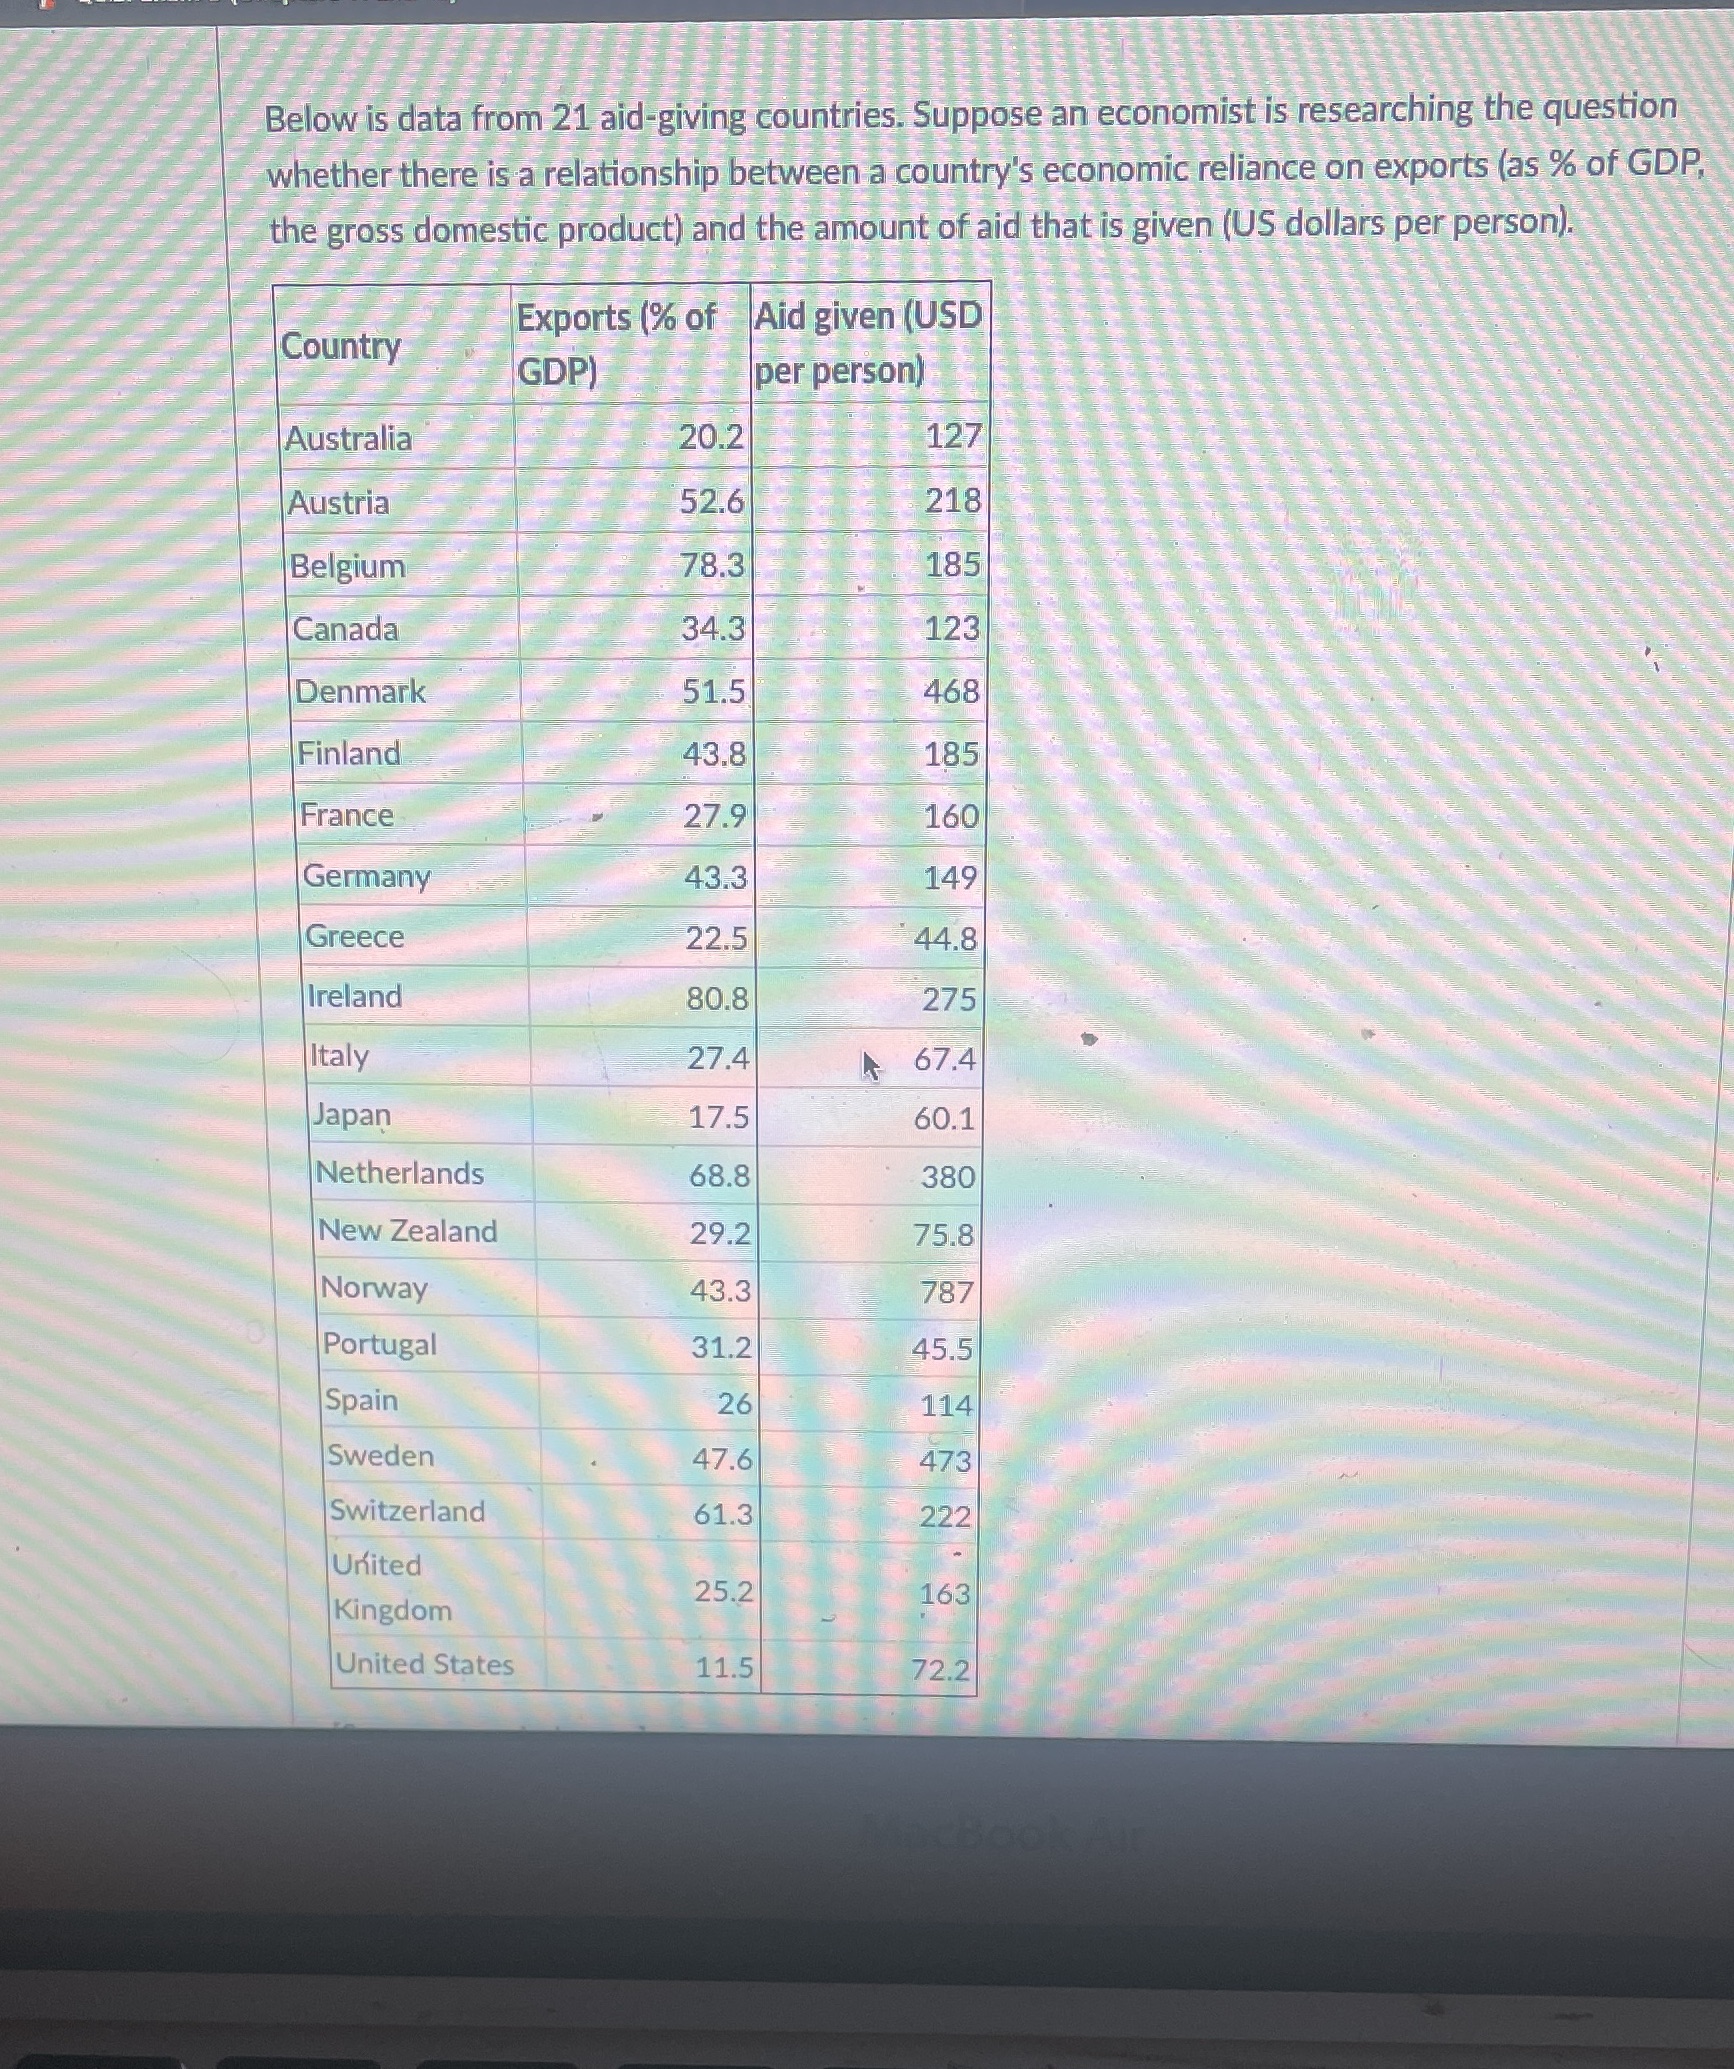
a) Determine the independent variable and the dependent variable.(a) Use technology to create a scatterplot of the data. Does there appear to be a relationship
a) Determine the independent variable and the dependent variable.(a) Use technology to create a scatterplot of the data. Does there appear to be a relationship between the variables? If so, describe this relationship.(c) Express the equation of the best fit line in the form??=?+??. Round a to one decimal place and round b to three decimal places.(d) Are there any suspected outliers? Calculate the predicted value for this suspected outlier and compare to the actual value.(e) Test the significance of the correlation coefficient. State the null and alternative hypotheses. Use this Table of 95% Critical Values (Links to an external site.) to determine the critical value rc. State the conclusion of the test.95% Critical Values of the Sample Correlation Coefficient TableDegrees of Freedom: n - 2 Critical Values: (+ and -)1 0.9972 0.9503 0.8784 0.8115 0.7546 0.7077 0.6668 0.6329 0.60210 0.57611 0.55512 0.53213 0.51414 0.49715 0.48216 0.46817 0.45618 0.44419 0.43320 0.42321 0.41322 0.40423 0.39624 0.38825 0.38126 0.37427 0.36728 0.36129 0.35530 0.34940 0.30450 0.27360 0.25070 0.23280 0.21790 0.205100 0.195

Step by Step Solution
There are 3 Steps involved in it
Step: 1

See step-by-step solutions with expert insights and AI powered tools for academic success
Step: 2

Step: 3

Ace Your Homework with AI
Get the answers you need in no time with our AI-driven, step-by-step assistance
Get Started


