Answered step by step
Verified Expert Solution
Link Copied!

Question

1 Approved Answer

A diet clinic states that there is an average loss of 24 pounds for those who stay on the program for 20 weeks. The standard

  1. A diet clinic states that there is an average loss of 24 pounds for those who stay on the program for 20 weeks. The standard deviation is 5 pounds. The clinic tries a new diet, reducing salt intake to see whether that strategy will produce a different weight loss. A group of 40 volunteers loses an average 16.3 pounds each over 20 weeks. Should the clinic change the new diet? Use . Hypothesis testing

Give the following:

Step 1: State the null and alternative hypothesis.

H0:______________

HA:______________

Step 2: Identify the level of significance.

Step 3: Find the critical value. Sketch a graph and label the critical value.

Step 4: Computation for test statistics.

Step 5: Conclusion

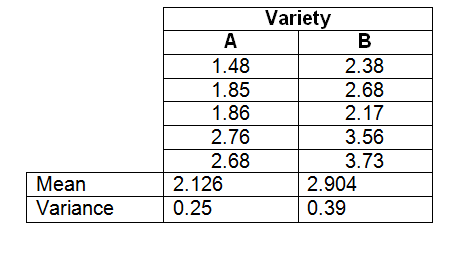
2.An experiment was made to compare two varieties of tomato concerning their fruit bearing abilities, measured in pounds. Do the following data present sufficient evidence to conclude that the fruit-bearing abilities of the two varieties are significantly different at 5% level?Independent T-test
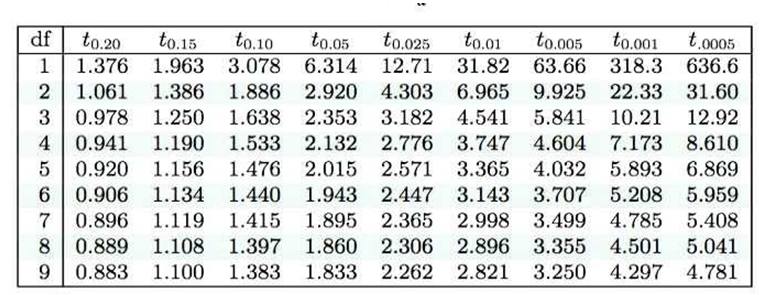
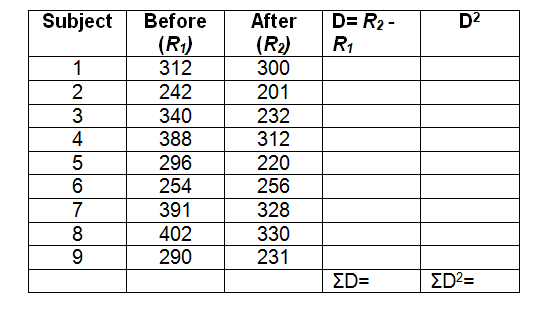
image text in transcribedimage text in transcribedimage text in transcribedimage text in transcribed
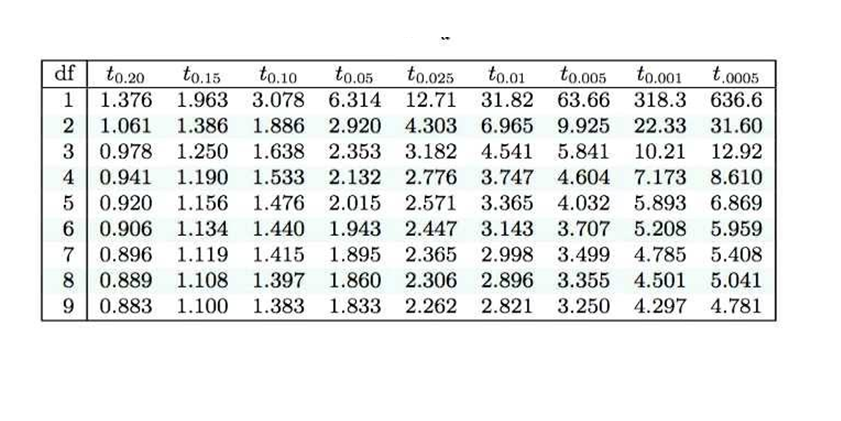
df to.20 to.15 to.10 to.05 to.025 to.01 to.005 to.001 t.0005 1.376 1.963 3.078 6.314 12.71 31.82 63.66 318.3 636.6 2 1.061 1.386 1.886 2.920 4.303 6.965 9.925 22.33 31.60 3 0.978 1.250 1.638 2.353 3.182 4.541 5.841 10.21 12.92 4 0.941 1.190 1.533 2.132 2.776 3.747 4.604 7.173 8.610 0.920 1.156 1.476 2.015 2.571 3.365 4.032 5.893 6.869 0.906 1.134 1.440 1.943 2.447 3.143 3.707 5.208 5.959 0.896 1.119 1.415 1.895 2.365 2.998 3.499 4.785 5.408 0.889 1.108 1.397 1.860 2.306 2.896 3.355 4.501 5.041 0.883 1.100 1.383 1.833 2.262 2.821 3.250 4.297 4.781Subject Before After D= R2 - D2 (R1) (R2) R1 312 300 N 242 201 3 340 232 388 312 5 296 220 6 254 256 7 391 328 402 330 290 231 ED= ED2=df to.20 to.15 to.10 to.05 to.025 to.01 to.005 to.001 t.0005 1 1.376 1.963 3.078 6.314 12.71 31.82 63.66 318.3 636.6 2 1.061 1.386 1.886 2.920 4.303 6.965 9.925 22.33 31.60 3 0.978 1.250 1.638 2.353 3.182 4.541 5.841 10.21 12.92 4 0.941 1.190 1.533 2.132 2.776 3.747 4.604 7.173 8.610 5 0.920 1.156 1.476 2.015 2.571 3.365 4.032 5.893 6.869 0.906 1.134 1.440 1.943 2.447 3.143 3.707 5.208 5.959 0.896 1.119 1.415 1.895 2.365 2.998 3.499 4.785 5.408 8 0.889 1.108 1.397 1.860 2.306 2.896 3.355 4.501 5.041 0.883 1.100 1.383 1.833 2.262 2.821 3.250 4.297 4.781Variety A B 1.48 2.38 1.85 2.68 1.86 2.17 2.76 3.56 2.68 3.73 Mean 2. 126 2.904 Variance 0.25 0.39

Step by Step Solution

There are 3 Steps involved in it

Step: 1

blur-text-image

Get Instant Access to Expert-Tailored Solutions

See step-by-step solutions with expert insights and AI powered tools for academic success

Step: 2

blur-text-image

Step: 3

blur-text-image

Ace Your Homework with AI

Get the answers you need in no time with our AI-driven, step-by-step assistance

Get Started

Recommended Textbook for

Applied Calculus

Authors: Stefan Waner, Steven Costenoble

7th Edition

1337514306, 9781337514309

More Books

Students also viewed these Mathematics questions

Question

Persuasive Speaking Organizing Patterns in Persuasive Speaking?

Answered: 1 week ago