Answered step by step
Verified Expert Solution
Question
1 Approved Answer
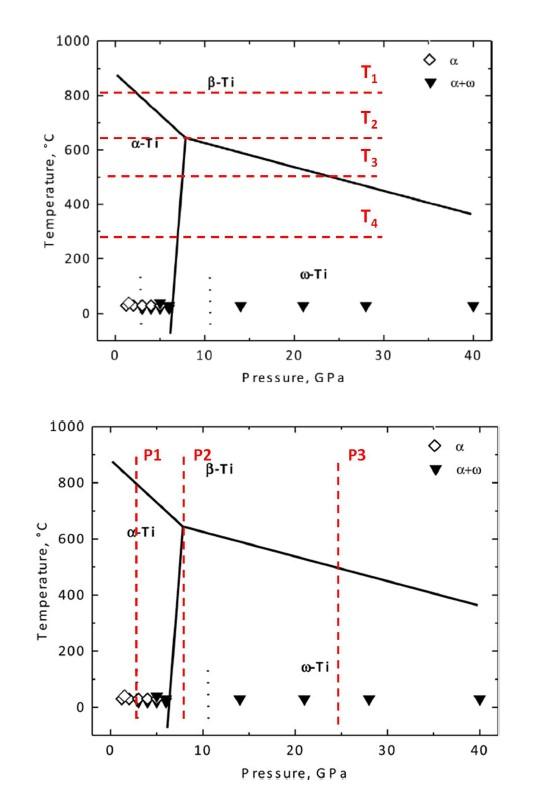
(a) Draw schematic Gibbs free energy-pressure curves (from 0 to 30 GPa) for pure Ti at the four temperatures indicated. Be sure to show the
(a) Draw schematic Gibbs free energy-pressure curves (from 0 to 30 GPa) for pure Ti at the four temperatures indicated. Be sure to show the correct dependence of (OG/DP) and justify the sign of the slope. (b) Draw schematic Gibbs free energy-temperature curves (from 0 to 1000 C) for pure Ti at the three pressures indicated. Be sure to show the correct dependence of (aG/DT) and justify the sign of the slope. 1000 a TI . B-Ti 06+00 1 1 - 1 1 1 1 1 1 1 800 1 T2 - - 600 OTT T3 Temperature, C 400 TA 1 1 1 200 0-TI 0 0 10 30 40 20 Pressure, GPS 1000 8 P1 P3 F P2 B-T O.+00 800 600 OLTI Temperature, C 400 200 0.-Ti 0 0 10 30 40 20 Pressure, GPS
Step by Step Solution
There are 3 Steps involved in it
Step: 1
Get Instant Access to Expert-Tailored Solutions
See step-by-step solutions with expert insights and AI powered tools for academic success
Step: 2
Step: 3
Ace Your Homework with AI
Get the answers you need in no time with our AI-driven, step-by-step assistance
Get Started