

Answered step by step
Verified Expert Solution
Question
1 Approved Answer
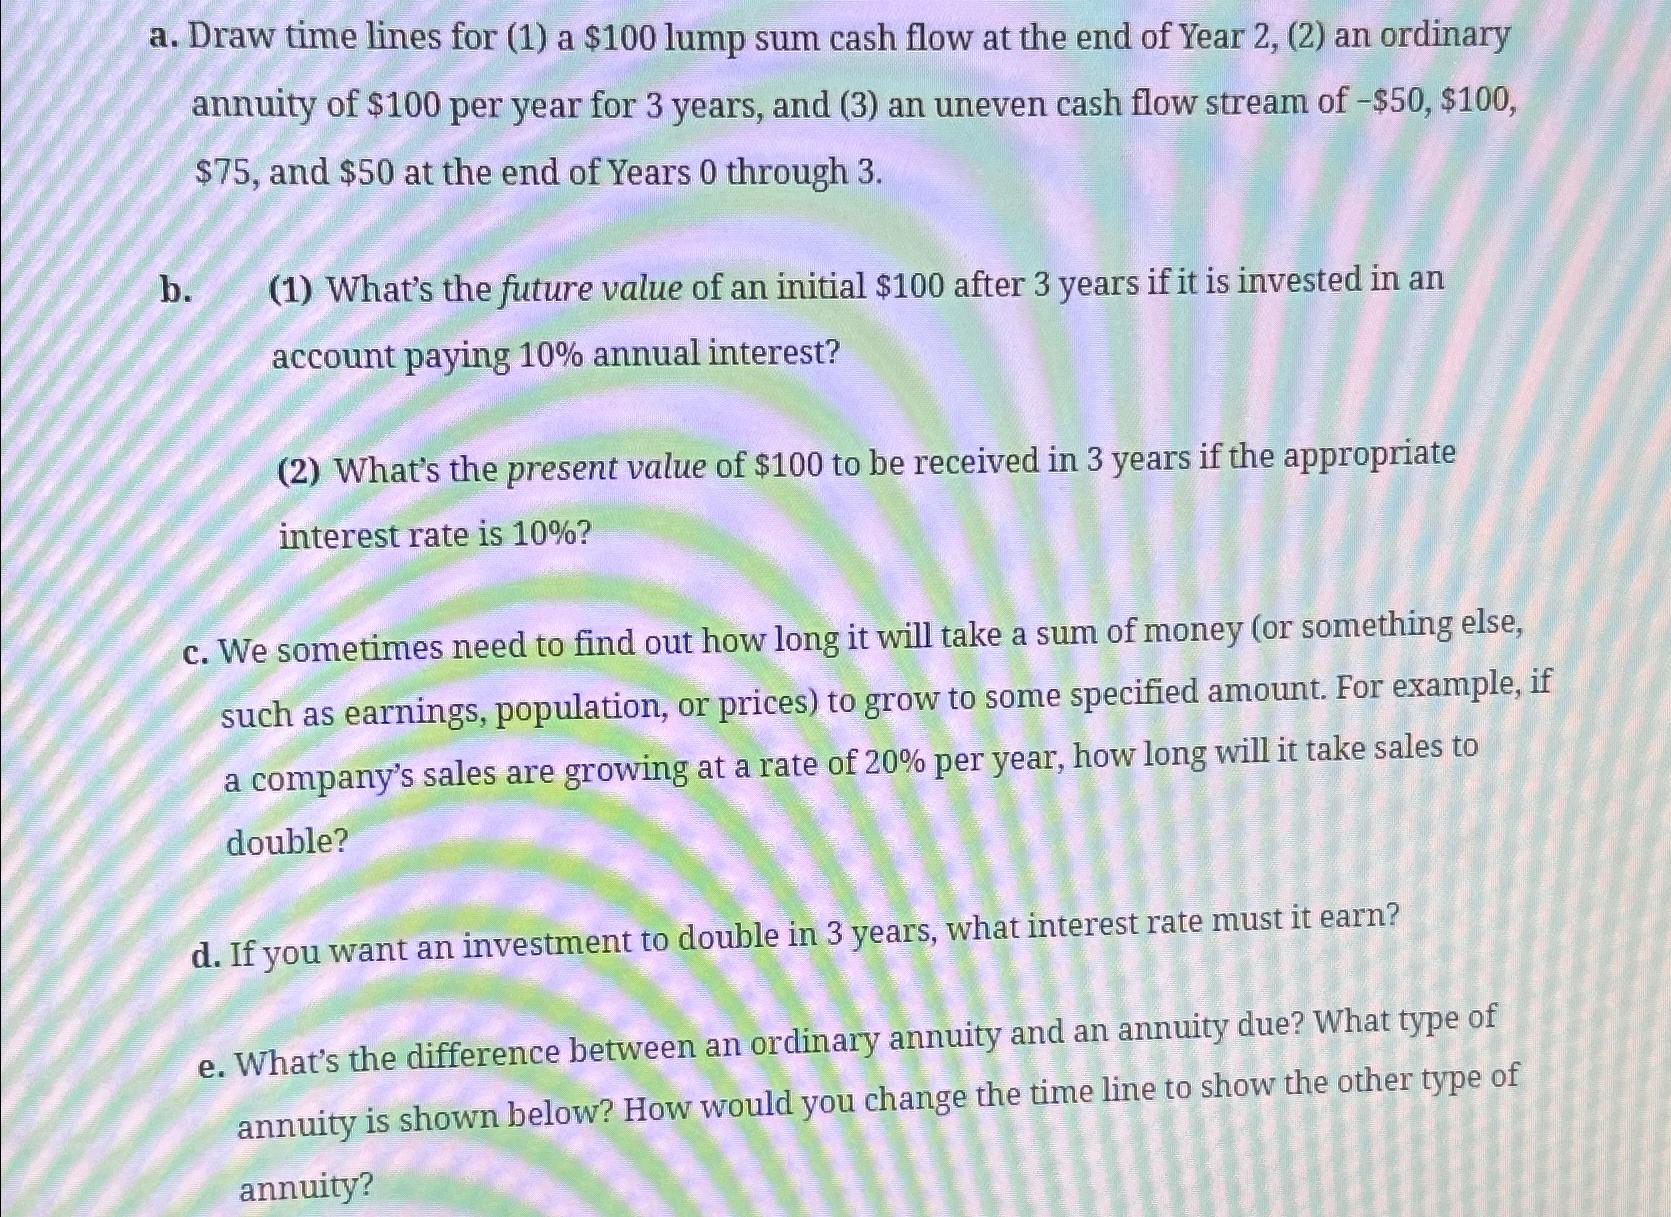
a . Draw time lines for ( 1 ) a $ 1 0 0 lump sum cash flow at the end of Year 2 ,
a Draw time lines for a $ lump sum cash flow at the end of Year an ordinary annuity of $ per year for years, and an uneven cash flow stream of $$ $ and $ at the end of Years through
b What's the future value of an initial $ after years if it is invested in an account paying annual interest?
What's the present value of $ to be received in years if the appropriate interest rate is
c We sometimes need to find out how long it will take a sum of money or something else, such as earnings, population, or prices to grow to some specified amount. For example, if a company's sales are growing at a rate of per year, how long will it take sales to double?
d If you want an investment to double in years, what interest rate must it earn?
e What's the difference between an ordinary annuity and an annuity due? What type of annuity is shown below? How would you change the time line to show the other type of annuity?
Step by Step Solution
There are 3 Steps involved in it
Step: 1

Get Instant Access to Expert-Tailored Solutions
See step-by-step solutions with expert insights and AI powered tools for academic success
Step: 2

Step: 3
Ace Your Homework with AI
Get the answers you need in no time with our AI-driven, step-by-step assistance
Get Started
Secured Finance Transactions Key Assets And Emergin Markets
Authors: Paul U Ali
1st Edition
1905783108, 978-1905783106