

Question: # a E 16 F X HX XXI E 348 minutes remaining To add a title and a y label to a specific Seaborn
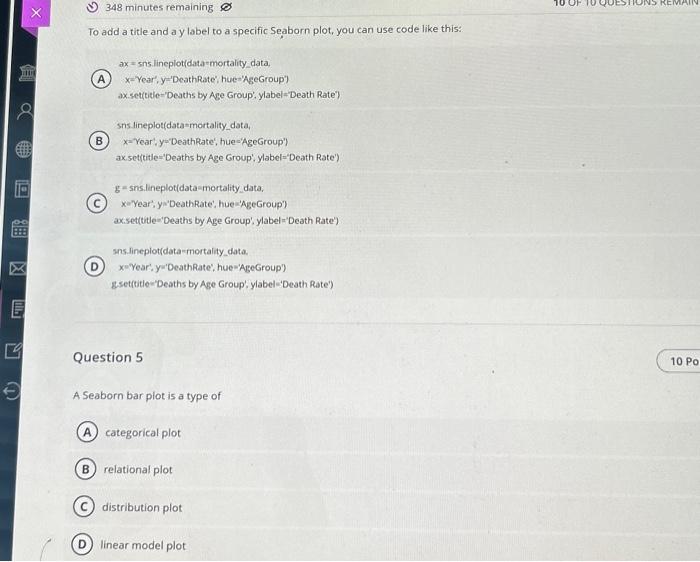
# a E 16 F X HX XXI E 348 minutes remaining To add a title and a y label to a specific Seaborn plot, you can use code like this: ax = sns.lineplot(data-mortality data, x-Year', y-'DeathRate', hue='AgeGroup) ax.set(title="Deaths by Age Group'. ylabel="Death Rate") sns lineplot(data mortality data, B x="Year, y-"DeathRate', hue='AgeGroup") ax.set(title="Deaths by Age Group', ylabel='Death Rate') g-sns.lineplot(data mortality data, x"Year", y"DeathRate", hue='AgeGroup') ax.set(title="Deaths by Age Group'. ylabel='Death Rate') B sns.lineplot(data mortality data. x="Year", y'DeathRate", hue='AgeGroup') g.set(title="Deaths by Age Group'. ylabel='Death Rate') Question 5 A Seaborn bar plot is a type of A categorical plot relational plot distribution plot linear model plot KEP 10 Po
Step by Step Solution
3.43 Rating (153 Votes )
There are 3 Steps involved in it
The correct code to add a title and a ylabel to a specif... View full answer

Get step-by-step solutions from verified subject matter experts