

Question
a. Estimate the historical CAGR in sales for WMT from 2013 to 2022. [Enter the answer in as a percent (e.g., 5.55%=5.55) - not a
a. Estimate the historical CAGR in sales for WMT from 2013 to 2022. [Enter the answer in as a percent (e.g., 5.55%=5.55) - not a decimal]
b. What is the intrinsic value for WMT using the relative P/B model?
Assumptions:
- Book value per share are calculated as total shareholders' equity divided by primary shares outstanding.
- Expected growth rate in earnings is equal to the historical CAGR in sales from the previous problem.
- Expected industry P/B multiple is 5.45.
c. What is the weighted average cost of capital (WACC) for WMT at the most recent fiscal year end?
Assumptions:
- Market value of equity is the current stock price ($160) multiplied by primary shares outstanding.
- Market value of debt is equal to book value of long-term debt.
- Required rate of return on equity is measured using the CAPM (market return is 9%, risk-free is 3.5%, and beta is 0.5).
- Required rate of return on debt is equal to its most recent interest expense divided by long-term-debt.
- The tax rate is equal to its most recent income taxes divided by pretax income.
[Enter the answer as a percent (e.g., 5.55% = 5.55) - not a decimal]
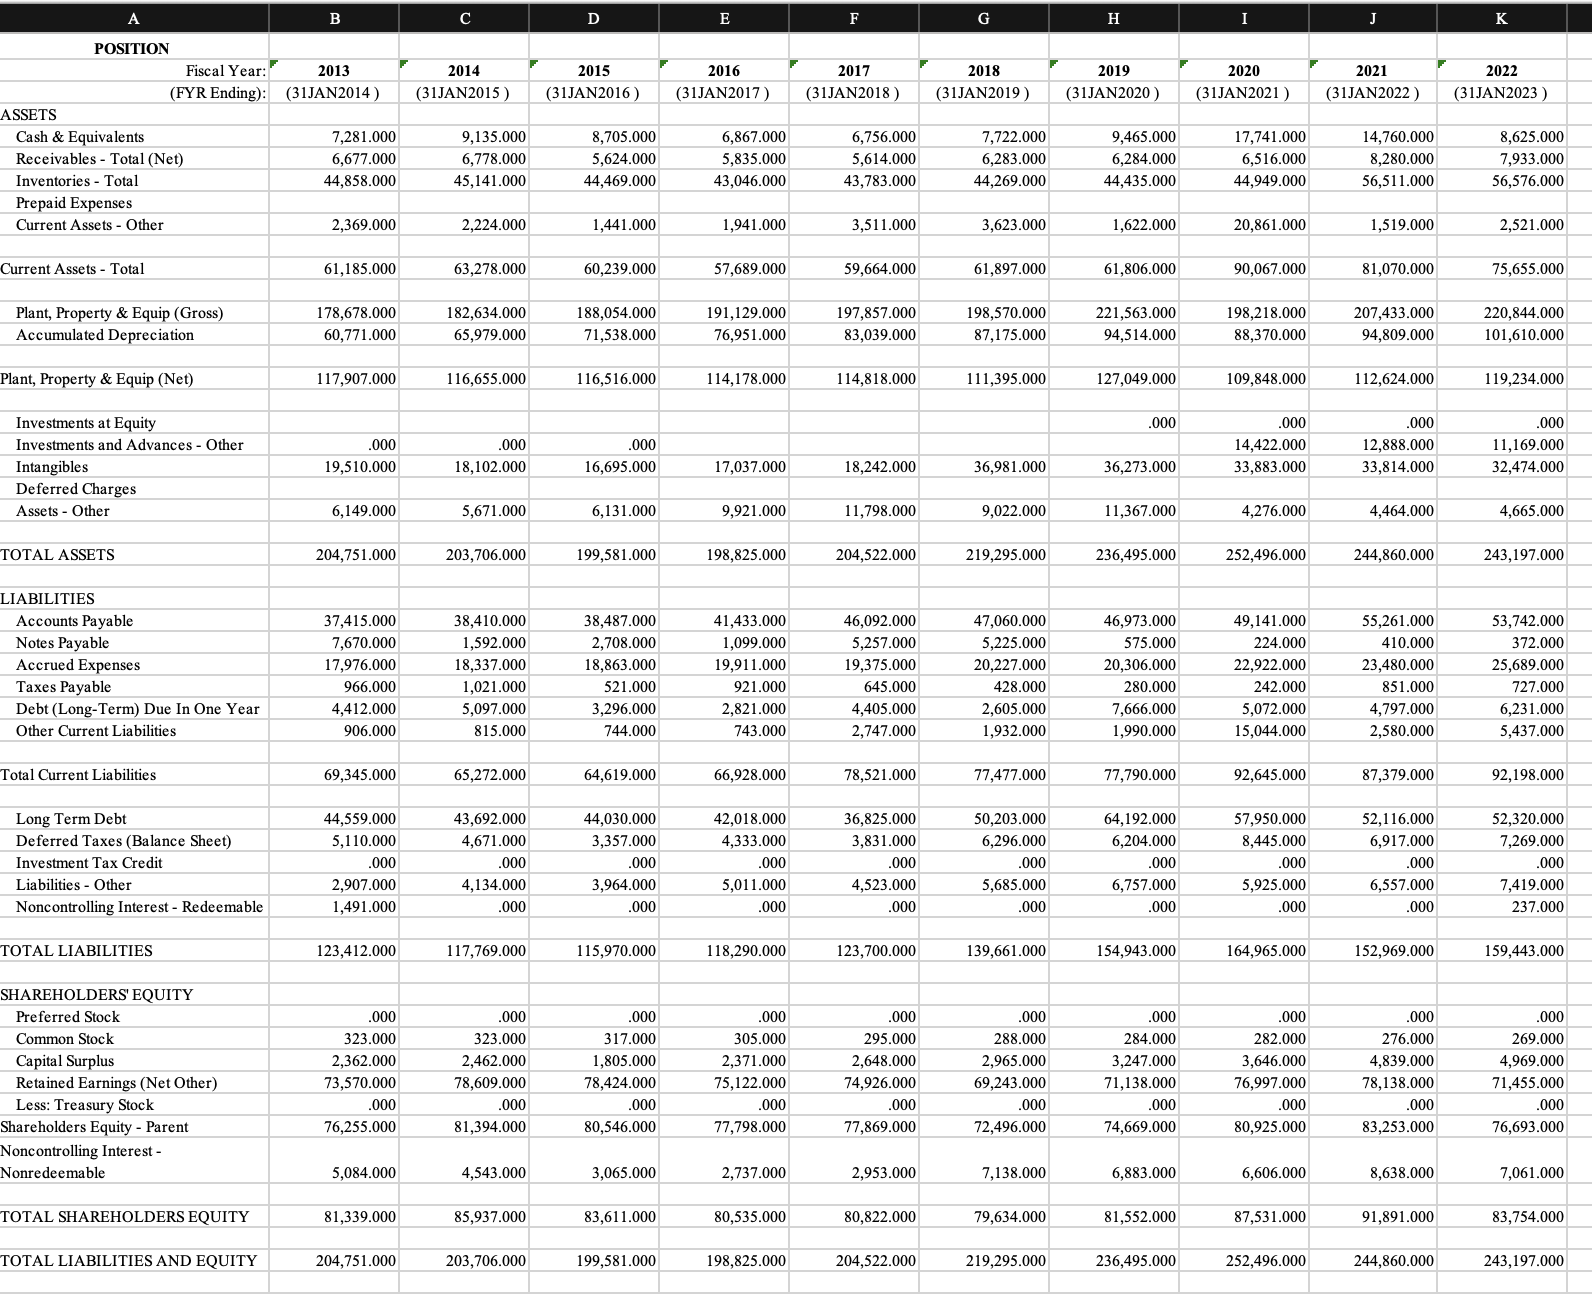 \begin{tabular}{|c|c|c|c|c|c|c|c|c|c|c|} \hline A & B & C & D & E & F & G & H & I & J & K \\ \hline \multicolumn{11}{|l|}{ POSITION } \\ \hline Fiscal Year: & 2013 & 2014 & 2015 & 2016 & 2017 & 2018 & 2019 & 2020 & 2021 & 2022 \\ \hline (FYR Ending): & (31JAN2014) & (31JAN2015) & (31JAN2016) & (31JAN2017) & (31JAN2018) & (31JAN2019) & (31JAN2020) & (31JAN2021) & (31JAN2022) & (31JAN2023) \\ \hline \multicolumn{11}{|l|}{ ASSETS } \\ \hline Cash \& Equivalents & 7,281.000 & 9,135.000 & 8,705.000 & 6,867.000 & 6,756.000 & 7,722.000 & 9,465.000 & 17,741.000 & 14,760.000 & 8,625.000 \\ \hline Receivables - Total (Net) & 6,677.000 & 6,778.000 & 5,624.000 & 5,835.000 & 5,614.000 & 6,283.000 & 6,284.000 & 6,516.000 & 8,280.000 & 7,933.000 \\ \hline Inventories - Total & 44,858.000 & 45,141.000 & 44,469.000 & 43,046.000 & 43,783.000 & 44,269.000 & 44,435.000 & 44,949.000 & 56,511.000 & 56,576.000 \\ \hline \multicolumn{11}{|l|}{ Prepaid Expenses } \\ \hline Current Assets - Other & 2,369.000 & 2,224.000 & 1,441.000 & 1,941.000 & 3,511.000 & 3,623.000 & 1,622.000 & 20,861.000 & 1,519.000 & 2,521.000 \\ \hline Current Assets - Total & 61,185.000 & 63,278.000 & 60,239.000 & 57,689.000 & 59,664.000 & 61,897.000 & 61,806.000 & 90,067.000 & 81,070.000 & 75,655.000 \\ \hline & & & & & & & & & & \\ \hline Plant, Property \& Equip (Gross) & 178,678.000 & 182,634.000 & 188,054.000 & 191,129.000 & 197,857.000 & 198,570.000 & 221,563.000 & 198,218.000 & 207,433.000 & 220,844.000 \\ \hline Accumulated Depreciation & 60,771.000 & 65,979.000 & 71,538.000 & 76,951.000 & 83,039.000 & 87,175.000 & 94,514.000 & 88,370.000 & 94,809.000 & 101,610.000 \\ \hline Plant, Property \& Equip (Net) & 117,907.000 & 116,655.000 & 116,516.000 & 114,178.000 & 114,818.000 & 111,395.000 & 127,049.000 & 109,848.000 & 112,624.000 & 119,234.000 \\ \hline & & & & & & & & & & \\ \hline Investments at Equity & & & & & & & .000 & .000 & .000 & .000 \\ \hline Investments and Advances - Other & .000 & .000 & .000 & & & & & 14,422.000 & 12,888.000 & 11,169.000 \\ \hline Intangibles & 19,510.000 & 18,102.000 & 16,695.000 & 17,037.000 & 18,242.000 & 36,981.000 & 36,273.000 & 33,883.000 & 33,814.000 & 32,474.000 \\ \hline \multicolumn{11}{|l|}{ Deferred Charges } \\ \hline Assets - Other & 6,149.000 & 5,671.000 & 6,131.000 & 9,921.000 & 11,798.000 & 9,022.000 & 11,367.000 & 4,276.000 & 4,464.000 & 4,665.000 \\ \hline TOTAL ASSETS & 204,751.000 & 203,706.000 & 199,581.000 & 198,825.000 & 204,522.000 & 219,295.000 & 236,495.000 & 252,496.000 & 244,860.000 & 243,197.000 \\ \hline & & & & & & & & & & \\ \hline \multicolumn{11}{|l|}{ LIABILITIES } \\ \hline Accounts Payable & 37,415.000 & 38,410.000 & 38,487.000 & 41,433.000 & 46,092.000 & 47,060.000 & 46,973.000 & 49,141.000 & 55,261.000 & 53,742.000 \\ \hline Notes Payable & 7,670.000 & 1,592.000 & 2,708.000 & 1,099.000 & 5,257.000 & 5,225.000 & 575.000 & 224.000 & 410.000 & 372.000 \\ \hline Accrued Expenses & 17,976.000 & 18,337.000 & 18,863.000 & 19,911.000 & 19,375.000 & 20,227.000 & 20,306.000 & 22,922.000 & 23,480.000 & 25,689.000 \\ \hline Taxes Payable & 966.000 & 1,021.000 & 521.000 & 921.000 & 645.000 & 428.000 & 280.000 & 242.000 & 851.000 & 727.000 \\ \hline Debt (Long-Term) Due In One Year & 4,412.000 & 5,097.000 & 3,296.000 & 2,821.000 & 4,405.000 & 2,605.000 & 7,666.000 & 5,072.000 & 4,797.000 & 6,231.000 \\ \hline Other Current Liabilities & 906.000 & 815.000 & 744.000 & 743.000 & 2,747.000 & 1,932.000 & 1,990.000 & 15,044.000 & 2,580.000 & 5,437.000 \\ \hline Total Current Liabilities & 69,345.000 & 65,272.000 & 64,619.000 & 66,928.000 & 78,521.000 & 77,477.000 & 77,790.000 & 92,645.000 & 87,379.000 & 92,198.000 \\ \hline Long Term Debt & 44,559.000 & 43,692.000 & 44,030.000 & 42,018.000 & 36,825.000 & 50,203.000 & 64,192.000 & 57,950.000 & 52,116.000 & 52,320.000 \\ \hline Deferred Taxes (Balance Sheet) & 5,110.000 & 4,671.000 & 3,357.000 & 4,333.000 & 3,831.000 & 6,296.000 & 6,204.000 & 8,445.000 & 6,917.000 & 7,269.000 \\ \hline Investment Tax Credit & .000 & .000 & .000 & .000 & .000 & .000 & .000 & .000 & .000 & .000 \\ \hline Liabilities - Other & 2,907.000 & 4,134.000 & 3,964.000 & 5,011.000 & 4,523.000 & 5,685.000 & 6,757.000 & 5,925.000 & 6,557.000 & 7,419.000 \\ \hline Noncontrolling Interest - Redeemable & 1,491.000 & .000 & .000 & .000 & .000 & .000 & .000 & .000 & .000 & 237.000 \\ \hline TOTAL LIABILITIES & 123,412.000 & 117,769.000 & 115,970.000 & 118,290.000 & 123,700.000 & 139,661.000 & 154,943.000 & 164,965.000 & 152,969.000 & 159,443.000 \\ \hline \multicolumn{11}{|l|}{ SHAREHOLDERS' EQUITY } \\ \hline Preferred Stock & .000 & .000 & .000 & .000 & .000 & .000 & .000 & .000 & .000 & .000 \\ \hline Common Stock & 323.000 & 323.000 & 317.000 & 305.000 & 295.000 & 288.000 & 284.000 & 282.000 & 276.000 & 269.000 \\ \hline Capital Surplus & 2,362.000 & 2,462.000 & 1,805.000 & 2,371.000 & 2,648.000 & 2,965.000 & 3,247.000 & 3,646.000 & 4,839.000 & 4,969.000 \\ \hline Retained Earnings (Net Other) & 73,570.000 & 78,609.000 & 78,424.000 & 75,122.000 & 74,926.000 & 69,243.000 & 71,138.000 & 76,997.000 & 78,138.000 & 71,455.000 \\ \hline Less: Treasury Stock & .000 & .000 & .000 & .000 & .000 & .000 & .000 & .000 & .000 & .000 \\ \hline Shareholders Equity - Parent & 76,255.000 & 81,394.000 & 80,546.000 & 77,798.000 & 77,869.000 & 72,496.000 & 74,669.000 & 80,925.000 & 83,253.000 & 76,693.000 \\ \hline \begin{tabular}{l} Noncontrolling Interest - \\ Nonredeemable \end{tabular} & 5,084.000 & 4,543.000 & 3,065.000 & 2,737.000 & 2,953.000 & 7,138.000 & 6,883.000 & 6,606.000 & 8,638.000 & 7,061.000 \\ \hline TOTAL SHAREHOLDERS EQUITY & 81,339.000 & 85,937.000 & 83,611.000 & 80,535.000 & 80,822.000 & 79,634.000 & 81,552.000 & 87,531.000 & 91,891.000 & 83,754.000 \\ \hline TOTAL LIABILITIES AND EQUITY & 204,751.000 & 203,706.000 & 199,581.000 & 198,825.000 & 204,522.000 & 219,295.000 & 236,495.000 & 252,496.000 & 244,860.000 & 243,197.000 \\ \hline \end{tabular}
 Step by Step Solution
There are 3 Steps involved in it
Step: 1

Get Instant Access to Expert-Tailored Solutions
See step-by-step solutions with expert insights and AI powered tools for academic success
Step: 2

Step: 3
Ace Your Homework with AI
Get the answers you need in no time with our AI-driven, step-by-step assistance
Get Started
The Organic Farmers Business Handbook A Complete Guide To Managing Finances Crops And Staff And Making A Profit
Authors: Richard Wiswall
1st Edition
1603581421, 978-1603581424