

Answered step by step
Verified Expert Solution
Question
1 Approved Answer
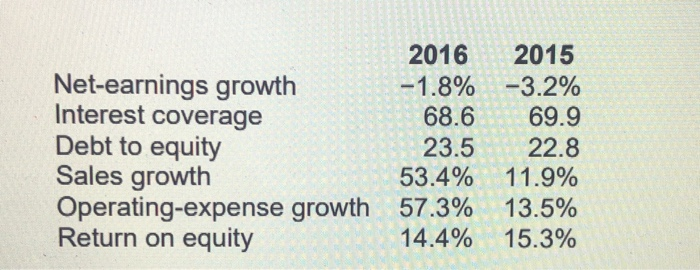
A ) explain what the following raitos & if they are good or bad for a company from 2016 to 2015 2016 2015 Net-earnings growth
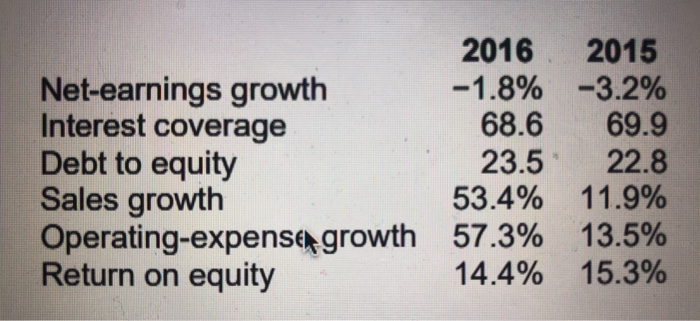
A ) explain what the following raitos & if they are good or bad for a company from 2016 to 2015
Step by Step Solution
There are 3 Steps involved in it
Step: 1

Get Instant Access to Expert-Tailored Solutions
See step-by-step solutions with expert insights and AI powered tools for academic success
Step: 2

Step: 3
Ace Your Homework with AI
Get the answers you need in no time with our AI-driven, step-by-step assistance
Get Started
Report Of Audit Resolution Questioned Costs Federal Superfund Program Department Of Health And Environmental Sciences 1994
Authors: Montana Dept Of Health And Environm
1st Edition
101924657X, 978-1019246573