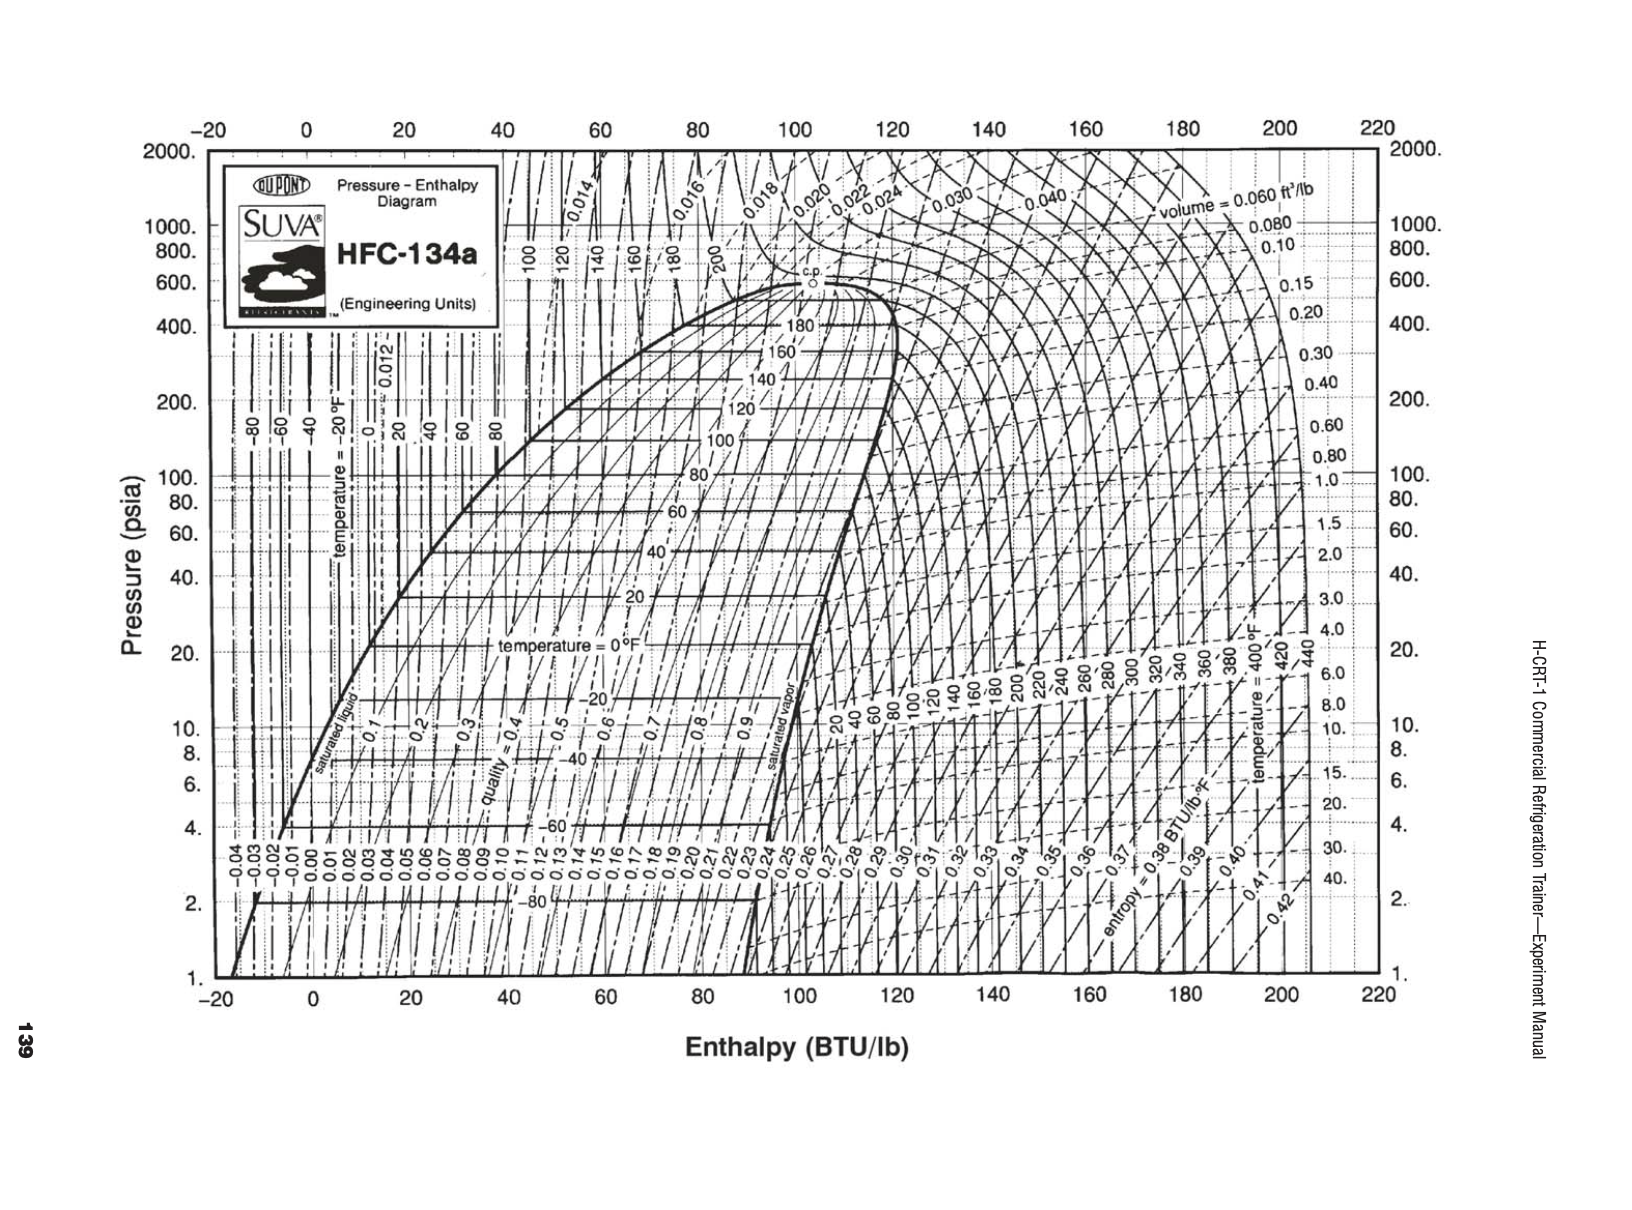
Using these pressure and temperature points, plot the graph of refrigeration cycle using the pressure and enthalpy diagram for refrigerant 134a. P1 (evaporator inlet) 49
Using these pressure and temperature points, plot the graph of refrigeration cycle using the pressure and enthalpy diagram for refrigerant 134a.


P1 (evaporator inlet) 49 psi P2 (evaporator outlet) 47 psi P3 (compressor inlet) 46 psi P4 (compressor outlet) 120 psi T1 (evaporator inlet) 51 F T2 (evaporator outlet) 55 F T3 (compressor inlet) 98 F T4 (compressor outlet) 97 F Exp valve --> Evaporator = PT1 = Inlet, PT2 = outlet PT3 = compressor inlet, PT4 = compressor outlet For exp 5, using automatic expansion valve
Step by Step Solution
There are 3 Steps involved in it
Step: 1
Since this is the ph diagram in which the we have to plot t...
See step-by-step solutions with expert insights and AI powered tools for academic success
Step: 2

Step: 3

Ace Your Homework with AI
Get the answers you need in no time with our AI-driven, step-by-step assistance
Get Started


